

Why It Matters
- Greater Transparency: With the Conversation AI Dashboard, you will gain real-time visibility into your bot’s performance, making it easier to track and understand its impact.
- Enhanced Optimization: The actionable insights provided enable you to continuously refine your bot responses, improving overall efficiency and effectiveness.
- Informed Decision-Making: Armed with data-driven insights, you can make smarter decisions, ultimately enhancing AI-driven customer interactions and maximizing the value of your bot.
How It Works
Access the Dashboard
To get started, navigate to the Conversation AI Bot tab inside the AI Agents section and select the Dashboards area.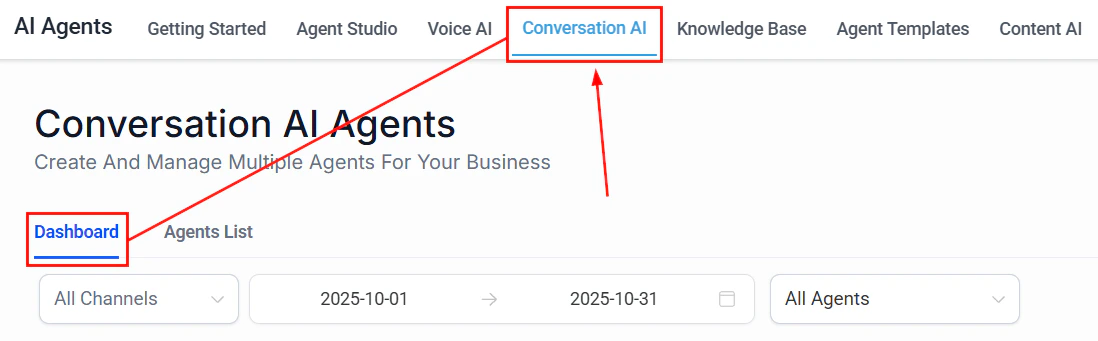
Screenshot
Filter & Compare Data
Refine your insights by using the Channel, Date Range, and Agent Selector. These tools allow you to narrow down the data to specific channels or periods, enabling side-by-side comparisons to track performance over time.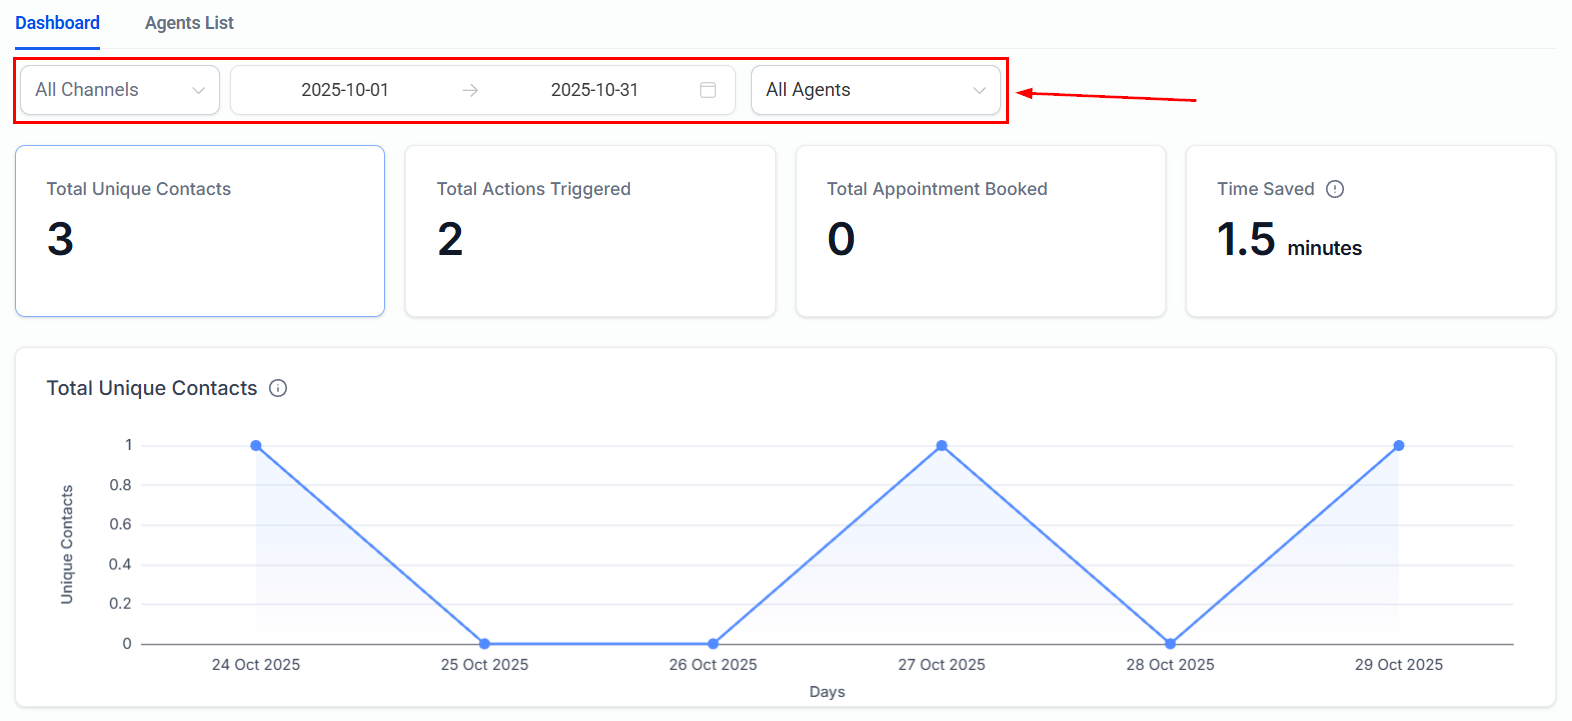
Screenshot
Monitor Key Metrics
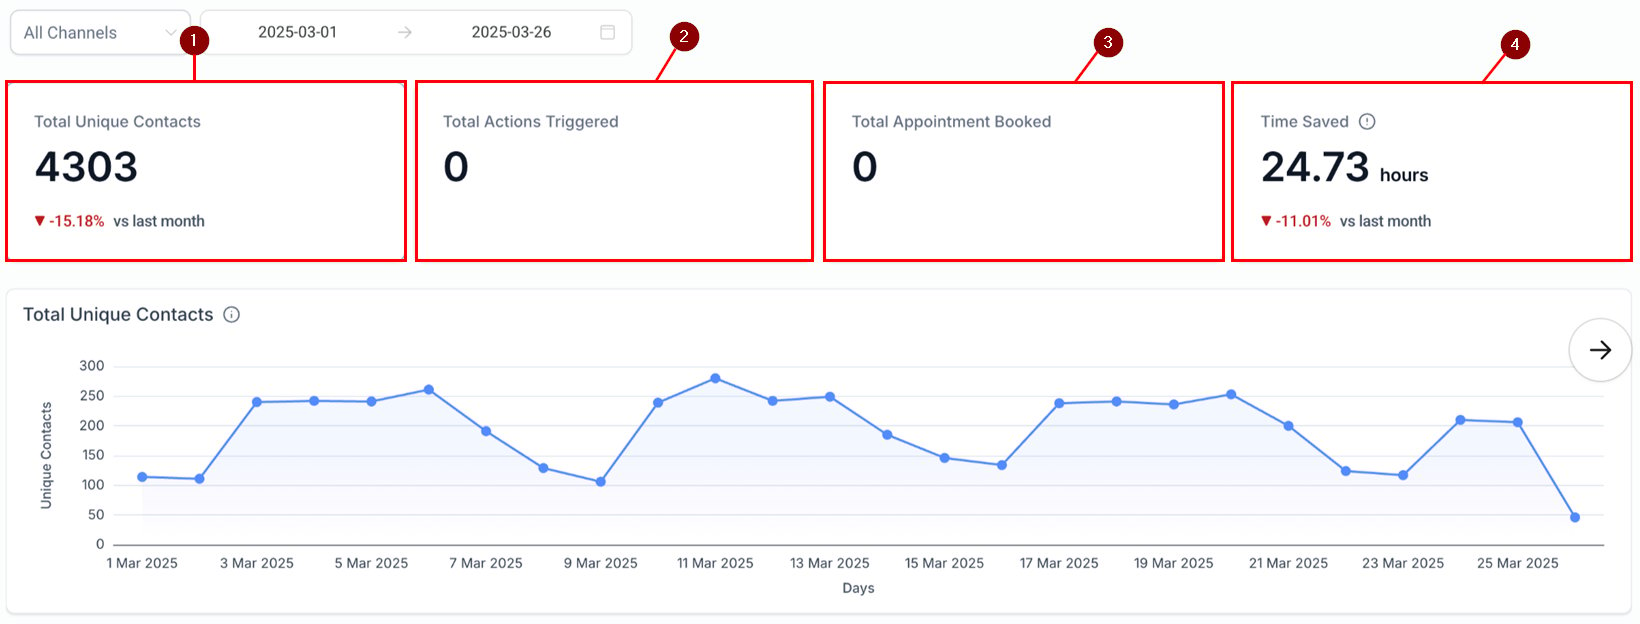
The dashboard provides real-time data on a variety of performance indicators, including:- Total Unique Contacts: The number of unique contacts engaged by the bot.
- Actions Triggered: The total number of bot-driven actions completed.
- Appointments Booked: The number of successful appointments made via the bot.
- Time Saved: An estimate of the reduction in manual effort, offering a clear view of productivity gains.
Screenshot
Screenshot
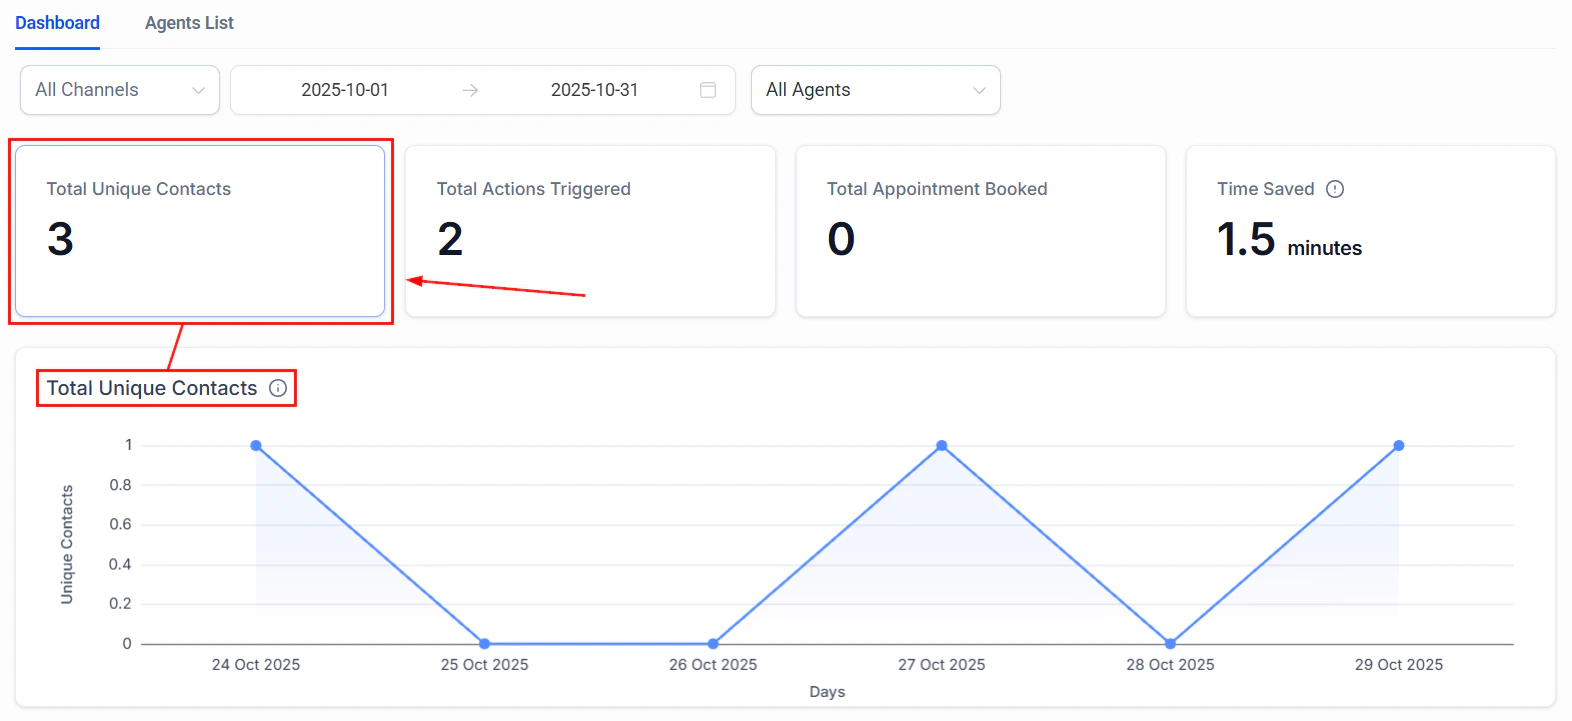
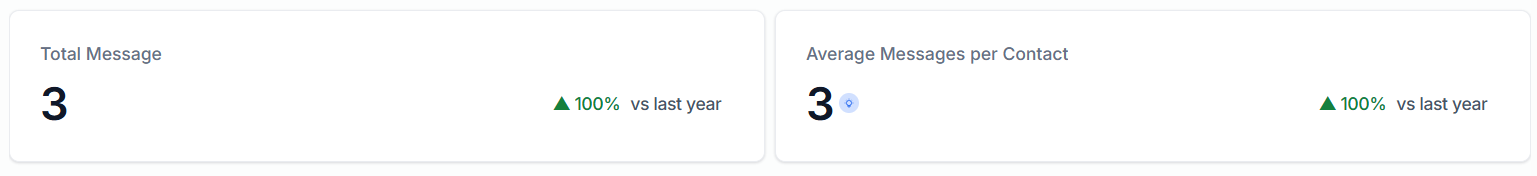
Total Unique Contacts
When this metric is selected, you will see:- Total Messages: The total number of messages sent during the selected period compared to the previous interval, providing a clear view of messaging volume and trends.
- Average Messages per Contact: A key metric that helps you optimize response settings by indicating the average number of messages exchanged with each contact, improving interaction efficiency.
Screenshot
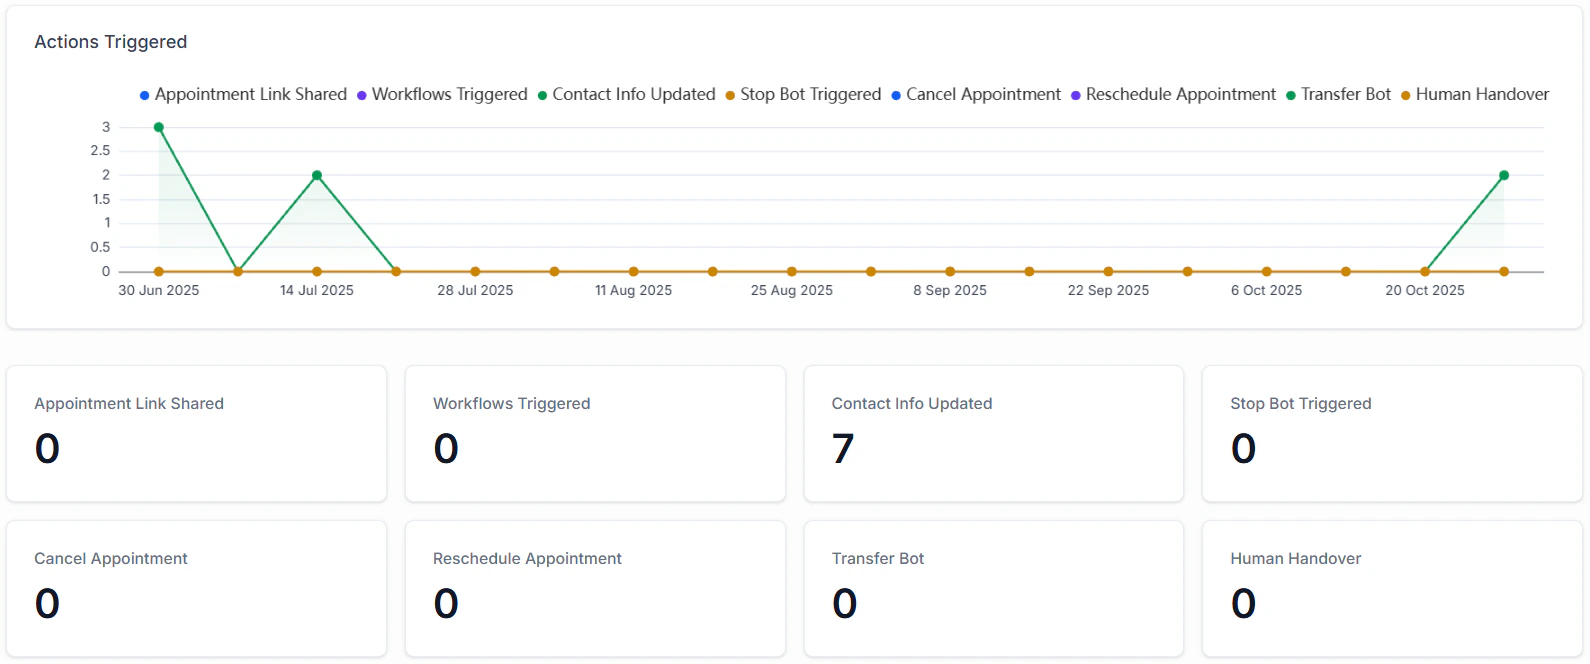
Total Actions Triggered
The Total Actions Triggered metric gives you insight into:- Appointment Link Shared: The number of times the bot sent your calendar booking link to contacts, facilitating easy appointment scheduling.
- Workflows Triggered: The total instances in which an automation was initiated as a result of a bot interaction.
- Contact Info Updated: The number of times a contact’s details were modified, ensuring accurate and up-to-date information.
- Stop Bot Triggered: The number of times the bot was stopped after meeting the specified condition.
- ****Cancel Appointment: ****The number of times the bot has removed a scheduled appointment from the calendar upon a customer’s request.
- ****Reschedule Appointment: ****The number of times the bot has moved a scheduled appointment from the calendar upon a customer’s request.
- ****Transfer Bot: ****The number of times the bot handed the conversation to another bot or workflow.
- ****Human Handover: ****The number of times the bot reassigned a conversation to a human agent.
Screenshot
Future Enhancements
Soon, the Conversation AI Dashboard will include the ability to identify common queries your bot receives and suggest adding them to the FAQ to improve response accuracy and bot efficiency.Conversation summaries and transcripts
When you’re managing customer conversations at scale, clarity is everything. Whether you’re tracking leads, handling support, or qualifying prospects, having an automatic summary of each interaction saves time, reduces manual work, and keeps your CRM organized. This guide will walk you through how to enable and configure automatic conversation summaries and transcripts inside your AI Bot settings — so every interaction is documented, actionable, and easy to review.How to Enable Conversation Summary
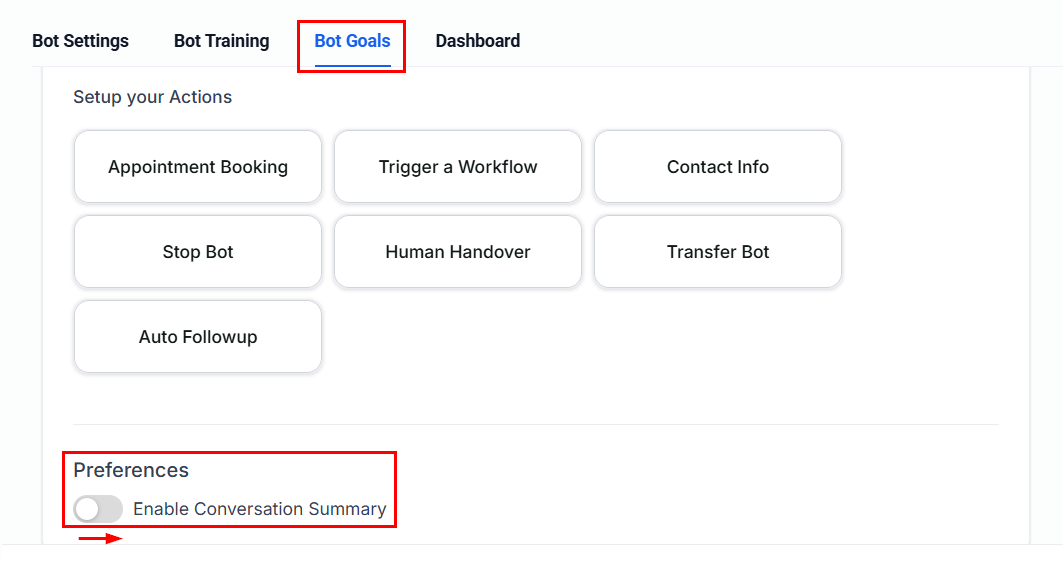
By default, conversation summaries are turned off, so you must manually enable the feature. To turn it on, navigate to AI Agents from the dashboard and select Conversation AI. Next, open an existing bot or create a new one.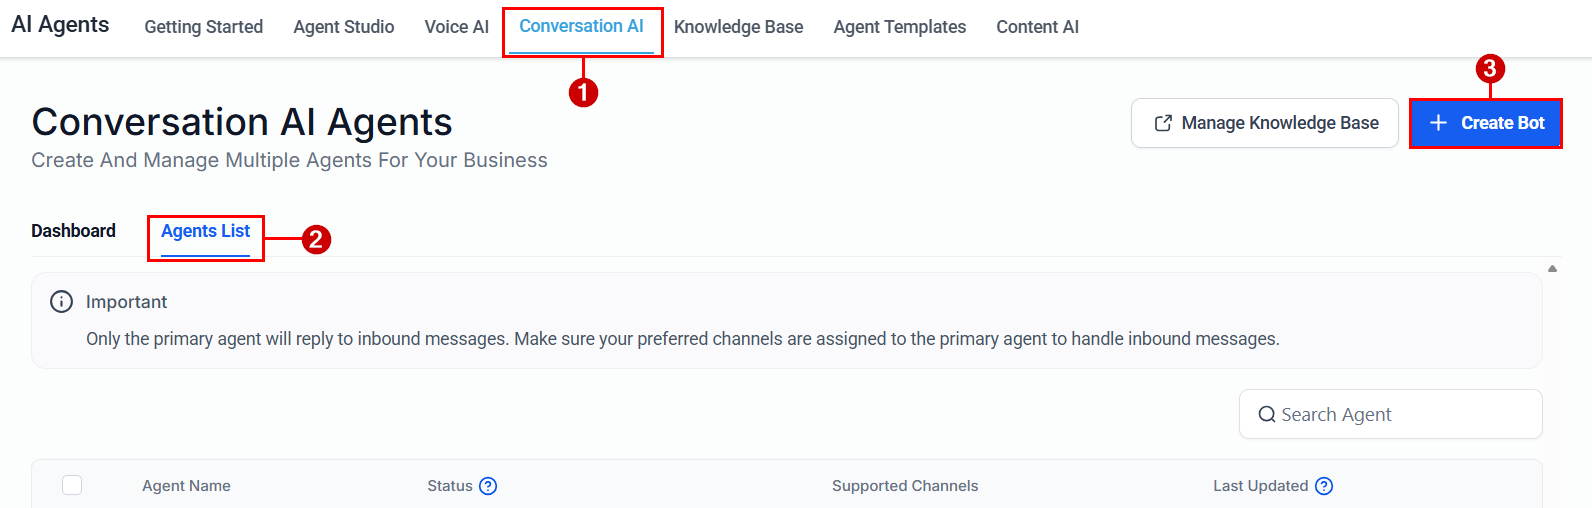
Screenshot
Screenshot
Inactivity Time
Set how long the conversation must be inactive before a summary is generated. For example, ff set to 15 minutes, and no messages are sent for 15 minutes, a summary is automatically created. This helps capture natural conversation endings.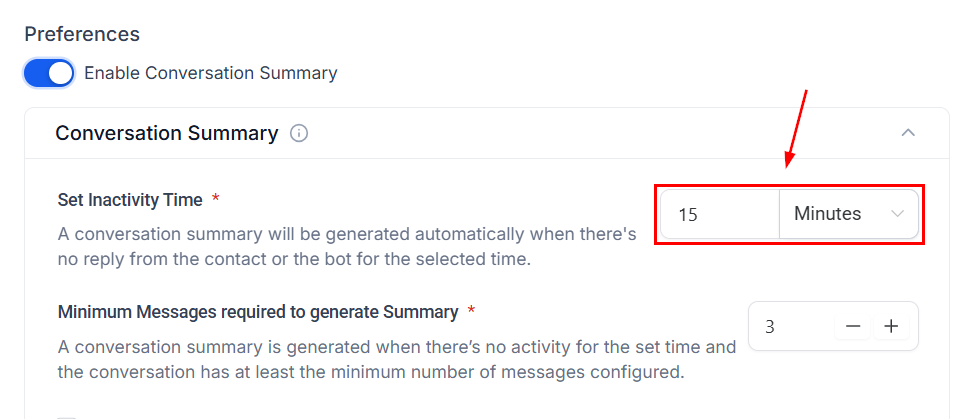
Screenshot
Minimum Messages Required
If the total message count in a conversation is below your defined minimum, no summary will be generated, even if inactivity time expires. This prevents unnecessary summaries for very short interactions.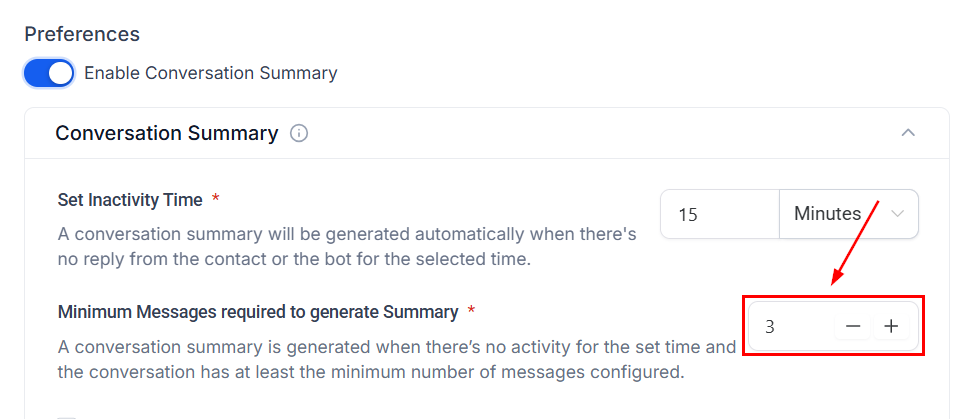
Screenshot
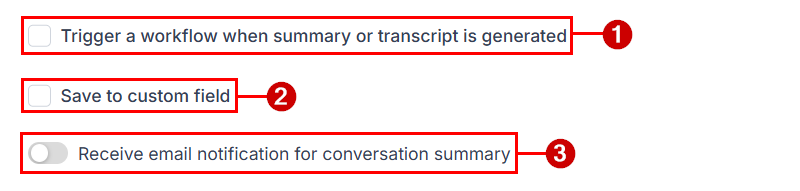
Additional Settings
- ****Trigger a Workflow When a Summary or Transcript is Generated: ****This allows you to create tasks, update contact information, notify team members, move opportunities in pipelines, and launch follow-up campaigns.
- ****Save to custom field: ****You can choose to automatically store the generated summary in a selected contact field. Each new summary replaces the previous one in that field, keeping contact records clean and up-to-date.
- ****Receive Email Notifications for Conversation Summary: ****You can configure who receives an email notification when a summary is generated. Options include: None, All admins, All users, Contact’s assigned user, Specific users, and Custom email addresses. This ensures the right people stay informed.
Screenshot
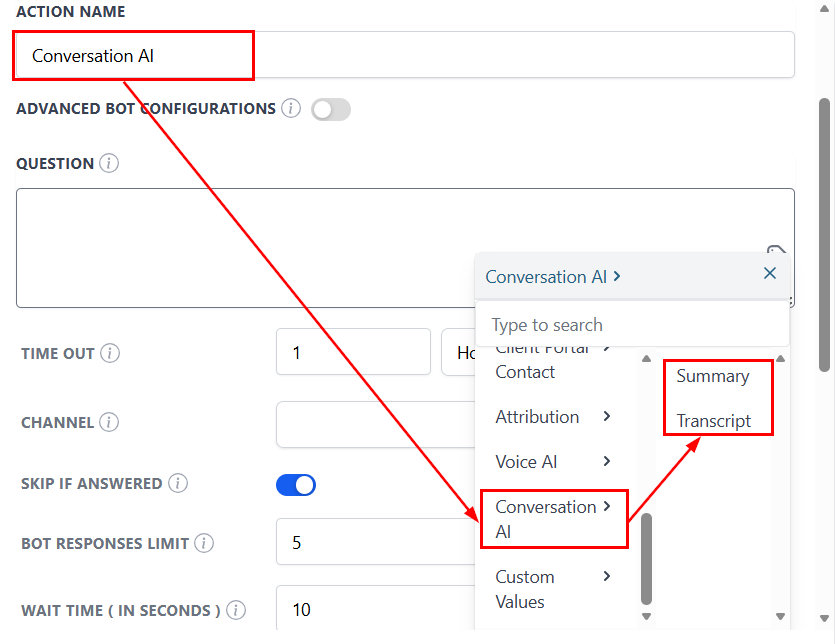
Accessing Summary & Transcript Data in Workflows
Inside workflows, you can use these variables:- Conversation AI → Summary
- Conversation AI → Transcript
Screenshot
✍Important Notes
- Summaries are session-based
- Each new session replaces previous summary data
- Summaries and transcripts are generated per session and always reflect the most recent conversation.
- All inbound and outbound messages are included (while enabled)
- Messages sent while the feature is OFF are ignored
- Re-enabling resumes tracking from that point forward