

Accessing funnel data
Funnel conversion data is available in two places:- Reporting → Agent Reporting → Conversions — per-agent funnel view by pipeline and stage
- CRM → Pipelines — overall pipeline view showing opportunities at each stage
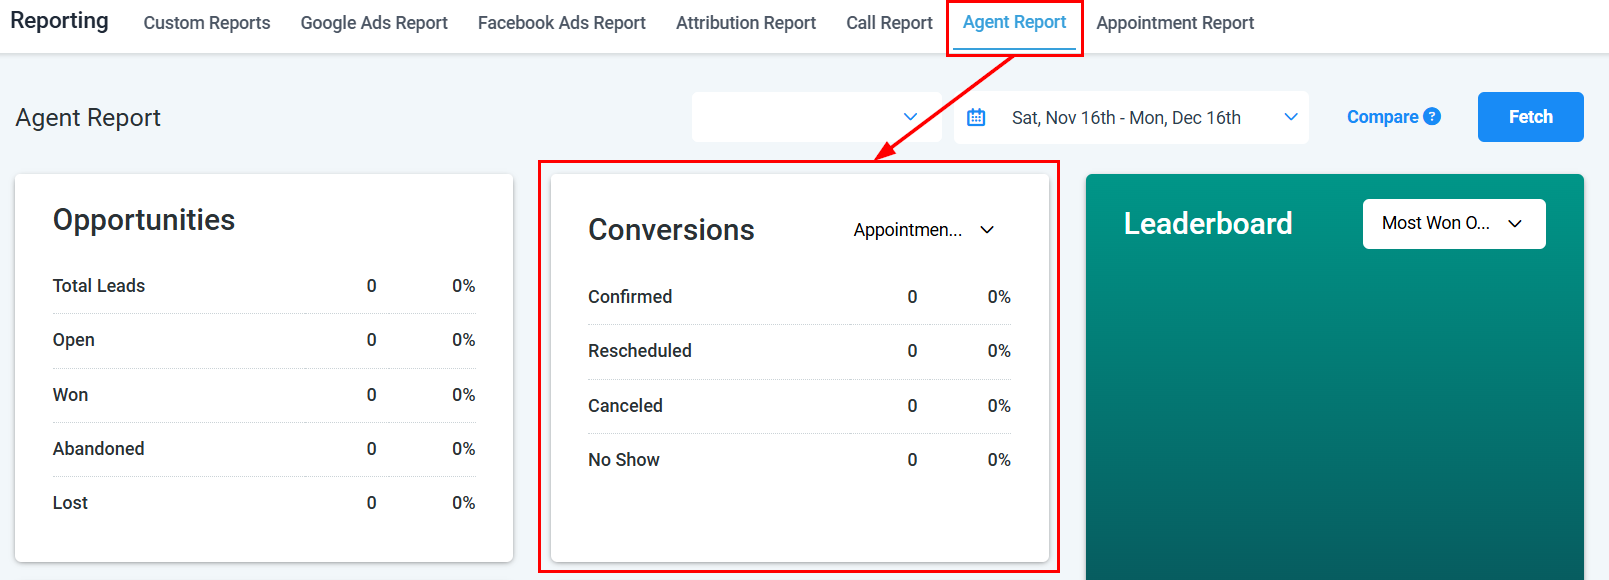
Agent Reporting conversions view showing pipeline stage breakdown
Reading a funnel report
A funnel report shows the number and percentage of opportunities at each stage of your pipeline, from initial entry to close. The key data points are:Pipeline filters
Use the filters in the Conversions section of Agent Reporting to focus your analysis:- Pipeline — select a specific pipeline to analyze
- Stages — choose which stages to include in the funnel view
- User — filter by agent to see individual conversion rates
- Date range — limit the analysis to a specific time period
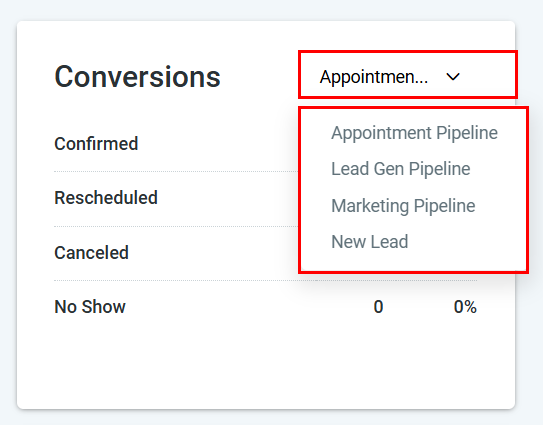
Pipeline filter in conversions view
Analyzing conversion rates
Identifying bottleneck stages
Identifying bottleneck stages
Look for stages with unusually high drop-off rates. A drop-off above 50% at a mid-funnel stage (such as Proposal Sent or Demo Scheduled) suggests a process, messaging, or qualification issue worth investigating.
Comparing agents on the same pipeline
Comparing agents on the same pipeline
Filter the Conversions section by individual agents on the same pipeline to compare stage-by-stage conversion rates. Agents who consistently advance more opportunities past a specific stage may have techniques worth sharing with the team.
Tracking funnel performance over time
Tracking funnel performance over time
Change the date range to compare conversion rates across different months or quarters. Improving conversion rates over time are a signal that process changes or coaching are taking effect.
Using custom reports for advanced funnel analysis
Using custom reports for advanced funnel analysis
Build a Custom Report with opportunities as the data source, add stage as a column, and apply date filters to create a fully exportable funnel view with the exact columns you need.
Building a funnel report in custom reports
For a fully customized funnel view, use Custom Reports:1
Create a new custom report
Go to Reporting → Custom Reports and click Create Report.
2
Select opportunities as the data source
Choose Opportunities as your data object.
3
Add stage and status columns
Include columns for pipeline name, stage name, opportunity value, status (open, won, lost), and assigned user.
4
Apply filters
Filter by pipeline, date range, and any other relevant criteria.
5
Add a chart widget
Add a bar or pie chart widget to visualize opportunity counts by stage. This gives you a visual funnel representation.
6
Save and share
Save the report and share it with your sales team for regular review.
Frequently asked questions
Is there a dedicated Funnel Report page in HoopAI?
Is there a dedicated Funnel Report page in HoopAI?
Funnel conversion data is surfaced within Agent Reporting (Conversions section) and the CRM Pipelines view rather than a standalone Funnel Report page. Custom Reports can be used to build a dedicated funnel report with your preferred columns and visualizations.
Can I see funnel data for all pipelines at once?
Can I see funnel data for all pipelines at once?
The Conversions section in Agent Reporting shows one pipeline at a time. To compare across pipelines, create a Custom Report with pipeline name as a column and group or filter as needed.
How do I find out how long deals are stuck at a stage?
How do I find out how long deals are stuck at a stage?
Use the Agent Reporting → Efficiency section to see average sales duration. For stage-level time data, build a Custom Report on opportunities that includes date fields for when each opportunity entered and exited a stage.
Can I export funnel report data?
Can I export funnel report data?
Yes. Export the Conversions view via the Agent Reporting export function, or build a Custom Report on opportunities and use the Export button to download as CSV or Excel.