

Revenue reporting dashboard showing payment trends and key metrics
Where to find revenue data
Revenue metrics appear in two places depending on what you need to measure:- Reporting → Revenue — transaction-level data covering invoices, payments, and order form completions tied to contacts and opportunities in your CRM.
- Dashboard → SaaS Analytics — subscription-focused MRR metrics for businesses running subscription or retainer-based billing through HoopAI.
Payment and invoice reporting
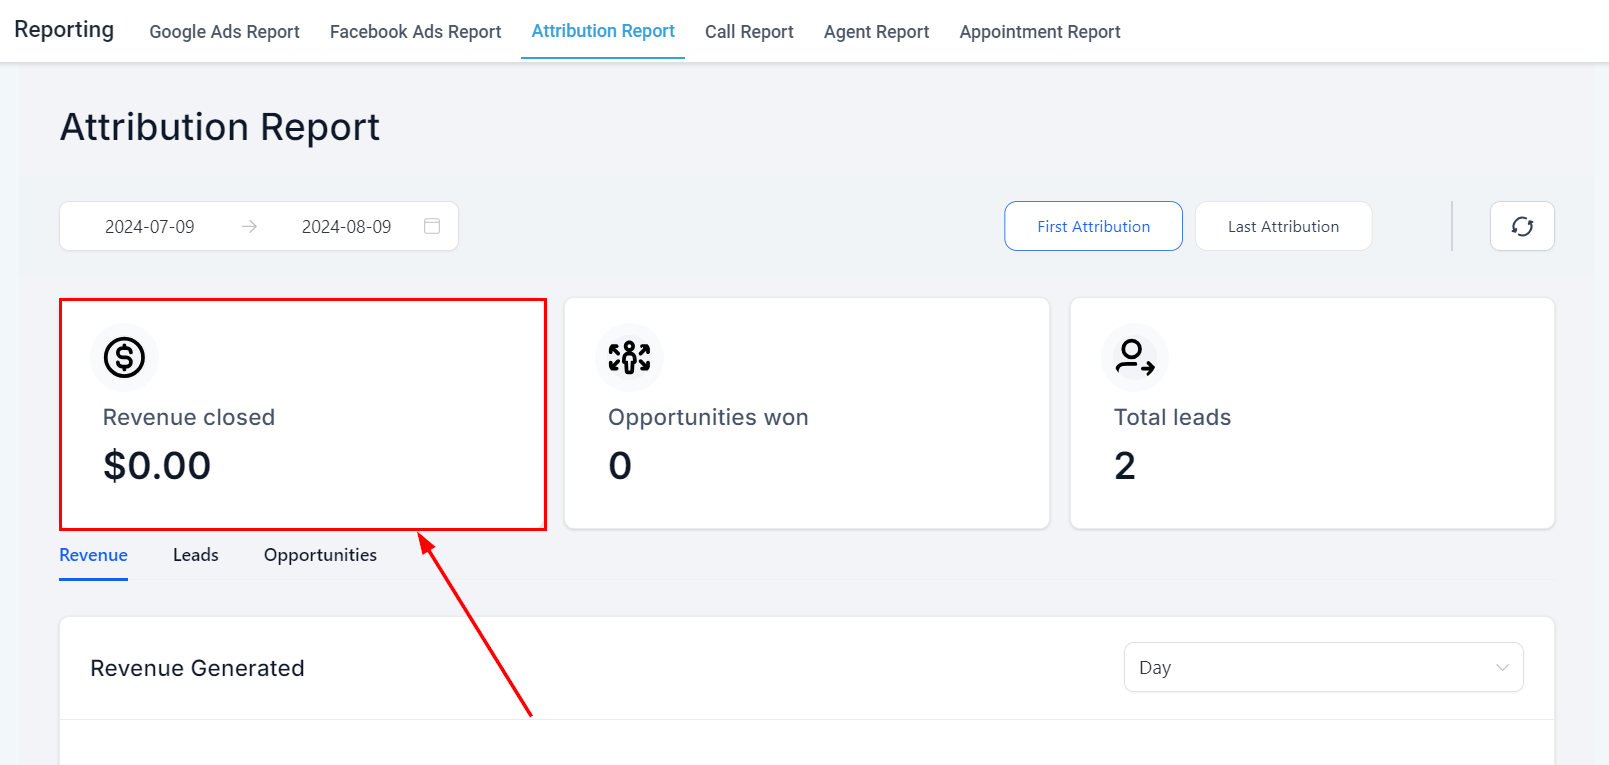
The revenue report provides a transaction-level breakdown of all payments processed through HoopAI, including order forms, invoices, and recurring subscription charges.Key metrics
Total revenue
Sum of all payments collected in the selected date range across all payment sources.
Number of transactions
Count of individual payment events, including one-time purchases and subscription charges.
Average transaction value
Total revenue divided by the number of transactions, useful for spotting shifts in product mix or pricing.
Refunds and disputes
Total value of refunded payments and open disputes that reduce net revenue.
Filtering options
Filter payment data by:- Date range — daily, weekly, monthly, or custom periods
- Payment source — order forms, invoices, or subscriptions
- Contact or opportunity — drill down to revenue tied to a specific deal or customer
- Payment status — paid, pending, failed, or refunded
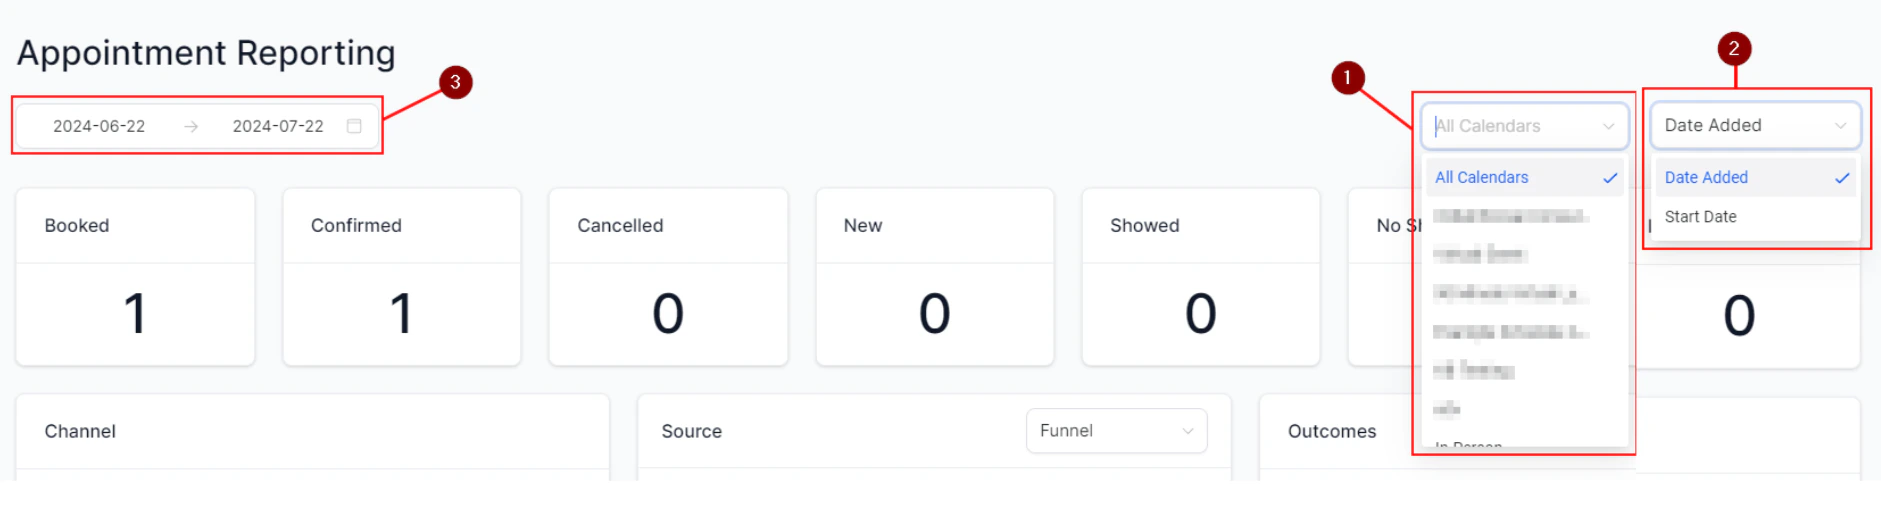
Revenue report with date range and payment source filters applied
Subscription and MRR reporting
For businesses running subscription billing through HoopAI, the SaaS Analytics dashboard tracks the full lifecycle of recurring revenue:
Net MRR change = New MRR + Expansion MRR − Contraction MRR − Churned MRR + Reactivation MRR.
MRR calculations in HoopAI use only revenue processed through native payment integrations. Payments recorded outside the platform (for example, via manual bank transfers or third-party invoicing tools) are not included in MRR totals.
Revenue trends and forecasting
The revenue dashboard displays trends over time so you can spot patterns, seasonal variations, and growth trajectories:- Monthly revenue bar chart — total collected revenue by month, useful for identifying high and low periods.
- MRR trend line — running total of monthly recurring revenue over time, showing growth or contraction.
- Churn rate — percentage of MRR lost in a given period relative to the MRR at the start of the period. A churn rate consistently above 5% per month warrants immediate attention.
- Annual Recurring Revenue (ARR) — calculated as MRR × 12, useful for annualized financial planning.
Revenue trend visualization with monthly bar chart and MRR trend line
Connecting revenue to contacts and opportunities
Every payment in HoopAI is linked to a contact record, which means you can trace revenue back to its original source through attribution data:- Open a contact record and navigate to the Payments tab to see their full transaction history.
- In the Opportunities pipeline, attach a monetary value to each opportunity stage to estimate projected revenue from your current pipeline.
- Use custom reports to build a view that joins opportunity close dates, deal values, and payment records to reconcile projected versus collected revenue.
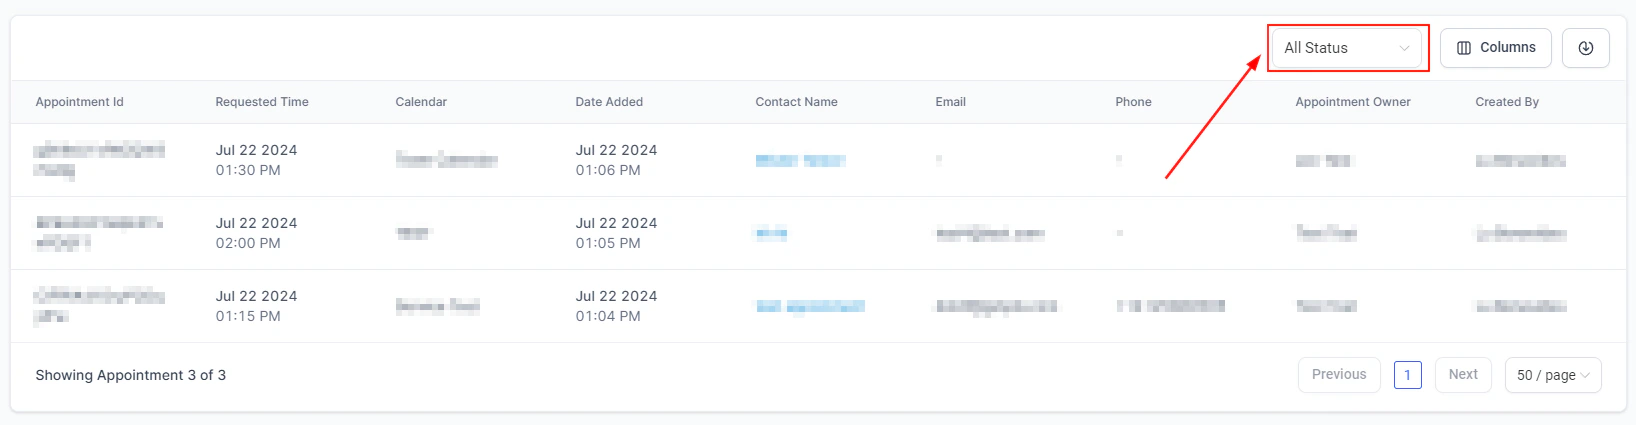
Exporting revenue data
Revenue reports can be exported as CSV files for use in external accounting, forecasting, or finance tools:- Navigate to Reporting → Revenue.
- Apply your desired date range and filters.
- Click Export to download the filtered dataset.
Frequently asked questions
Why does my total revenue differ from my payment processor's dashboard?
Why does my total revenue differ from my payment processor's dashboard?
HoopAI revenue figures reflect payments recorded within the platform. Refunds, disputed charges, or payments processed directly through your payment processor without going through a HoopAI order form or invoice may not be included. Always reconcile against your payment processor’s reports for accounting purposes.
Can I see revenue by product or service?
Can I see revenue by product or service?
Yes. If you use separate order forms or invoice line items for different products, you can filter the revenue report by the source form or product name. For more granular breakdowns, build a custom report grouped by product.
How do I track revenue from a specific marketing campaign?
How do I track revenue from a specific marketing campaign?
Use attribution reporting alongside revenue data. If contacts from a specific campaign also generated payments, you can filter your contact list by UTM campaign and cross-reference their payment history to calculate campaign-driven revenue.
Is ARR automatically calculated?
Is ARR automatically calculated?
ARR is displayed in the SaaS Analytics dashboard as a derived figure (MRR × 12). It is a forward-looking estimate based on current active subscriptions, not a sum of historical payments.