

What conversation widgets track
Conversation widgets pull data from your Conversations inbox and surface it as dashboard metrics. The key things they measure include:- Total conversations — the overall count of conversation threads within a date range
- Unread messages — the number of messages in your inbox that have not yet been read
- Conversations by channel — breakdown of conversations across communication channels such as SMS, email, Facebook Messenger, Instagram, live chat, and GMB messaging
- Conversations over time — trends showing how your conversation volume changes day by day or week by week
Adding a conversation widget
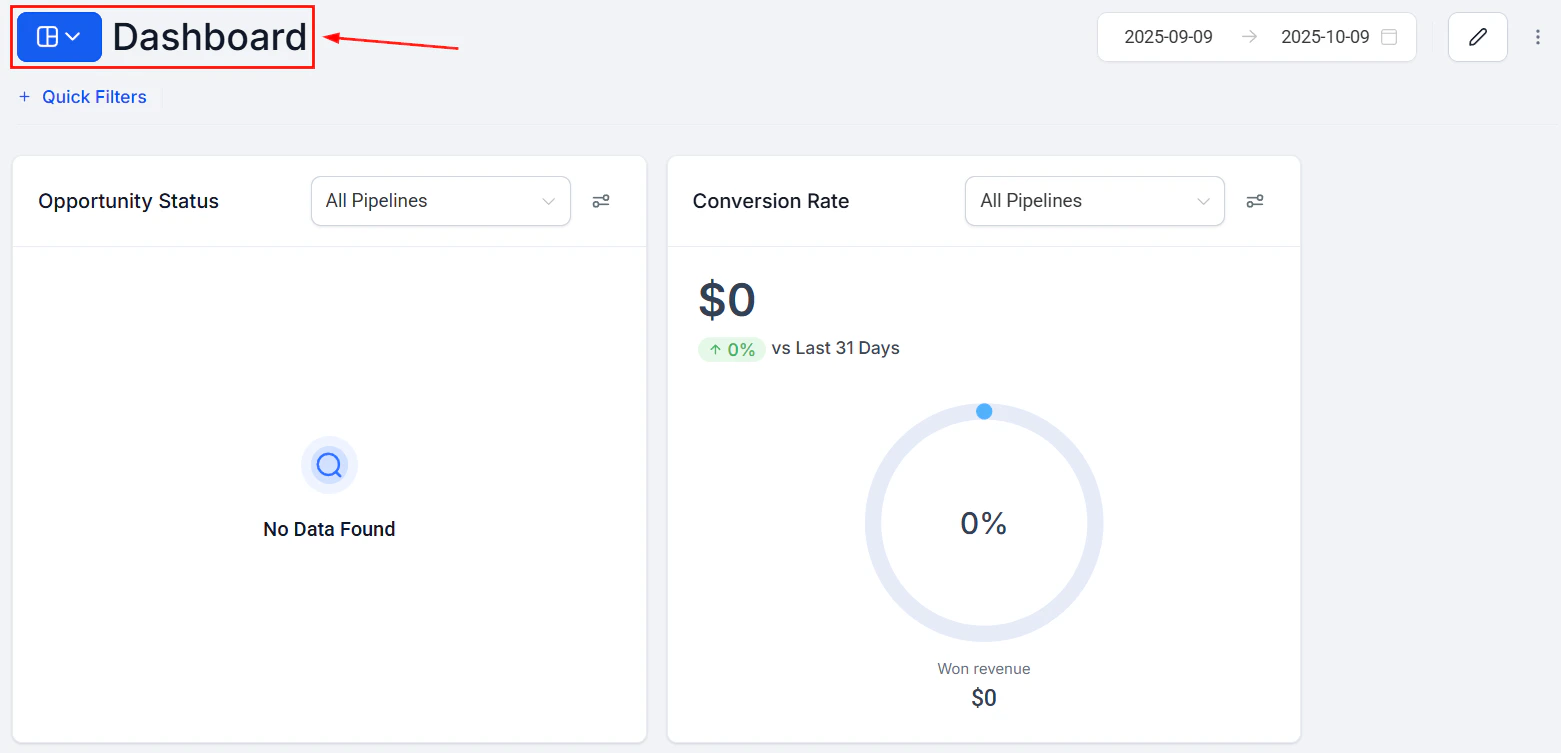
Conversation widgets on the HoopAI dashboard showing unread messages and channel activity
1
Enter edit mode
Navigate to your dashboard and click the pencil icon to enter edit mode.
2
Open the widget panel
Click “Add Widget” to open the widget selection panel on the right.
3
Select the Conversations category
Click the Conversations tab in the widget panel to see all available conversation widget types.
4
Choose a widget type
Click the widget type you want to add. It appears on the dashboard immediately.
5
Configure the widget
Click the three dots on the widget and select Edit to open the configuration panel and adjust the settings.
6
Save
Click Save, then click Save Changes to finalize the layout.
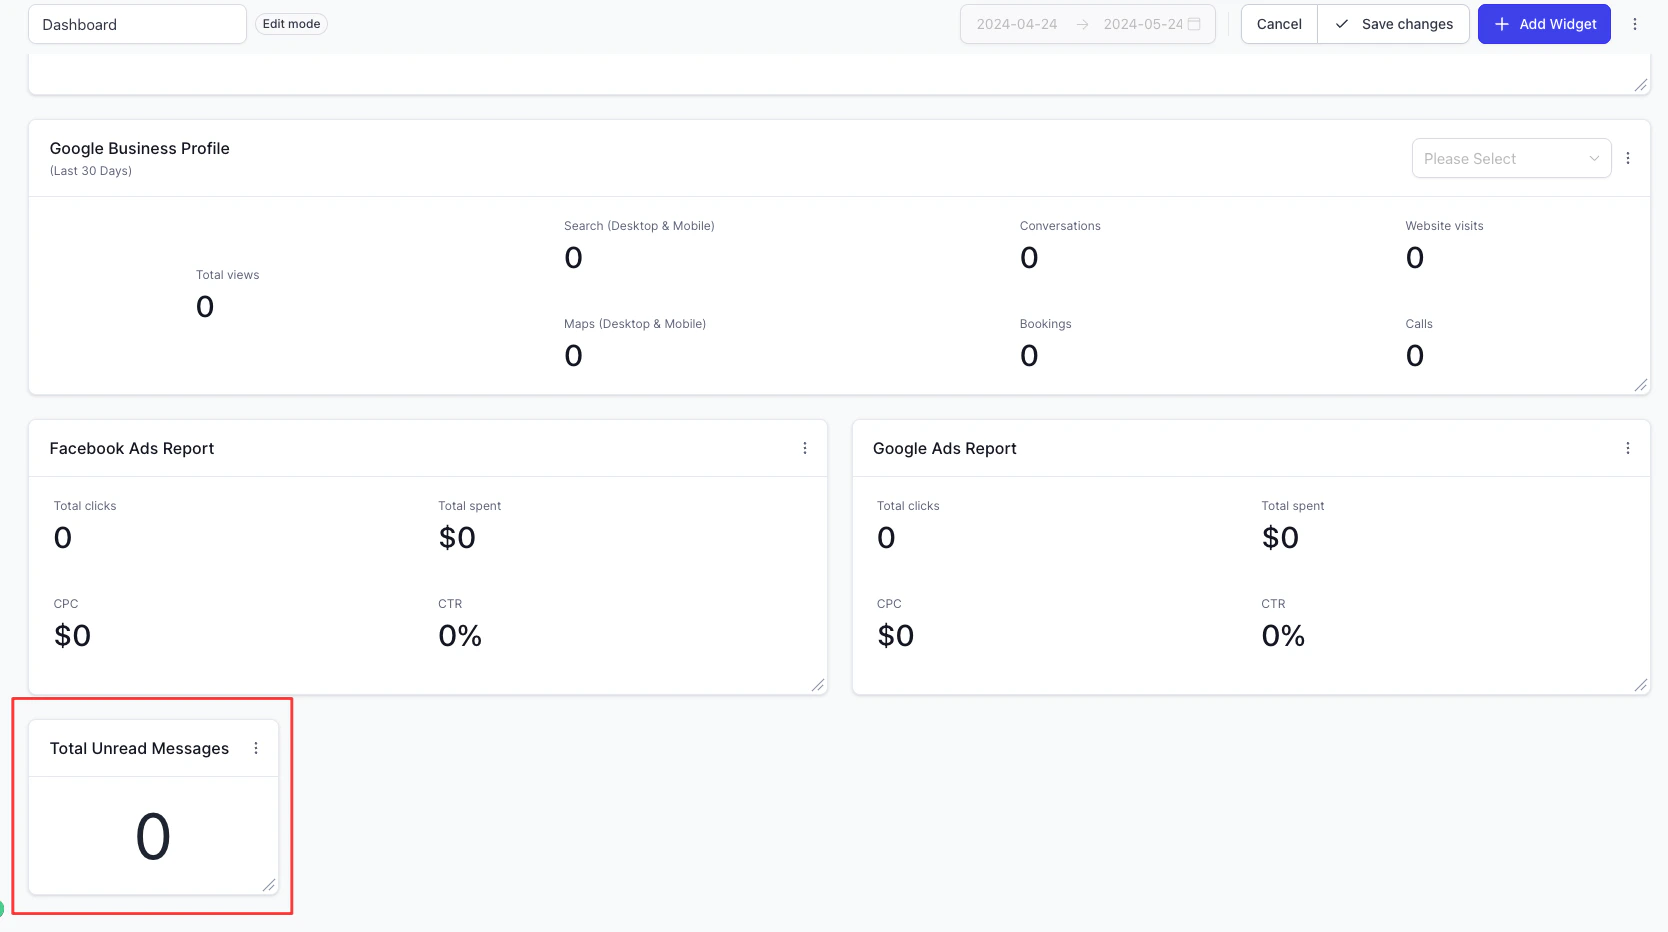
Unread messages widget
The unread messages widget is the most commonly used conversation widget. It displays the current count of unread messages in your inbox and updates in real time as new messages arrive and existing messages are read. This makes it ideal for keeping at the top of a team dashboard as a live inbox health indicator. Key behaviors of the unread messages widget:- Real-time updates — the count changes automatically as messages are opened or new ones arrive, without needing to refresh the page
- User-specific filtering — apply a “Logged in User” condition so each team member sees only the count of unread messages assigned to them
- Channel filtering — add a channel condition to track unread messages from a specific source, such as SMS only or live chat only
Filtering conversation widgets
Applying conditions to filter conversation widget data
Filter by channel
Filter by channel
Add a Channel condition to show conversations from a single communication channel — for example, only SMS conversations or only email threads. This is useful for teams that specialize in specific channels.
Filter by assigned user
Filter by assigned user
Add a User condition and select a specific team member to see their conversation load. Use “Logged in User” so each person automatically sees their own data when they view the dashboard.
Filter by contact tag
Filter by contact tag
Add a Contact Tag condition to show conversations associated with contacts that have a specific tag — for example, contacts tagged as “VIP” or “Hot Lead.”
Filter by conversation status
Filter by conversation status
Filter to Open or Closed conversations to understand how many active threads are in progress versus how many have been resolved within the date range.
Supported chart types
Conversation widgets support multiple visualization formats:Conversations by channel widget
The conversations by channel widget is particularly useful for teams managing communication across multiple platforms. It shows a breakdown — typically as a donut or bar chart — of how your total conversation volume is split across channels such as:- SMS / text
- Live chat (website widget)
- Facebook Messenger
- Instagram Direct
- Google Business Messaging
Using conversation widgets for team performance monitoring
You can build a team communications dashboard by combining several conversation widgets:- Unread messages per user — create one numeric widget per team member, each filtered to a specific user, so you can see whose inbox is most backlogged
- Total conversations this week — a numeric widget showing the team’s aggregate volume
- Conversations by channel — a donut chart showing distribution across all active channels
- Conversations over time — a line chart trending the past 30 days of conversation volume
Conversation widgets show data based on the date the conversation was created or the date a message was sent, depending on your date property selection. Verify the Date Property setting in the Configure tab matches your reporting intent.
Frequently asked questions
Why does my unread messages widget show a different count than my inbox?
Why does my unread messages widget show a different count than my inbox?
The unread messages widget reflects data within the configured date range. If your inbox shows unread messages older than the widget’s date range, those older messages will not be counted. Extend the date range or remove the date range override to see all unread messages regardless of age.
Does the unread messages widget update without refreshing the page?
Does the unread messages widget update without refreshing the page?
Yes. The unread messages widget updates in real time. As messages are opened and marked as read, or as new messages arrive, the count adjusts automatically.
Can I see conversations from a specific pipeline or contact segment?
Can I see conversations from a specific pipeline or contact segment?
You can filter by contact tags to focus on conversations with contacts in a specific segment. For pipeline-specific filtering, use the opportunity widgets instead, as conversations are not directly tied to pipeline stages.
How do I filter the widget to show only my own unread messages?
How do I filter the widget to show only my own unread messages?
Open the widget editor, go to the Conditions tab, add a User condition, and set it to “Logged in User.” This ensures each team member sees only their own conversation count when viewing the dashboard.