

Social media analytics dashboard with engagement and reach metrics
Supported platforms
The HoopAI social media analytics dashboard currently supports data from:- YouTube
- TikTok
- Google Business Profile
- Threads
- Bluesky
Accessing the analytics dashboard
Navigate to Marketing → Social Planner → Statistics to open the social media analytics dashboard. The dashboard displays aggregated data across all connected accounts by default, with filters available to isolate individual platforms or accounts.Key metrics
KPI overview
The top of the dashboard shows aggregate totals across all connected accounts for the selected time period:Total posts
Number of posts published across all platforms in the selected date range.
Total impressions
Total number of times any post was displayed on a user’s screen, counting multiple views by the same person.
Total reach
Number of unique accounts that saw at least one of your posts during the period.
Total engagements
Combined count of likes, comments, and shares across all published posts.
Followers
Net follower change across connected accounts during the selected period.
Comments
Total number of comments received on posts in the period.
Social post performance
The Social Post Performance chart combines a bar graph (showing weekly post publishing volume) with a line graph (showing daily engagement totals). This view makes it easy to spot the relationship between posting frequency and engagement response — for example, whether posting more frequently in a given week actually resulted in more total interactions. Week-over-week percentage changes are displayed alongside each metric so you can see momentum at a glance.
Social post performance chart with weekly publishing volume and engagement trends
Engagement breakdown by platform
The Engagement Stats section breaks likes, comments, and shares down by individual platform. Use this to understand which networks are driving the most interaction for your content type. A business posting the same content across LinkedIn and Facebook may find that one platform consistently outperforms the other in comments while the other drives more shares.Top performing posts
The Top Performing Posts table ranks your published content by likes received. Click into any post to see its individual metrics, including impressions, reach, and engagement rate. Use this list to identify content patterns — topics, formats, or posting times — that consistently outperform your averages.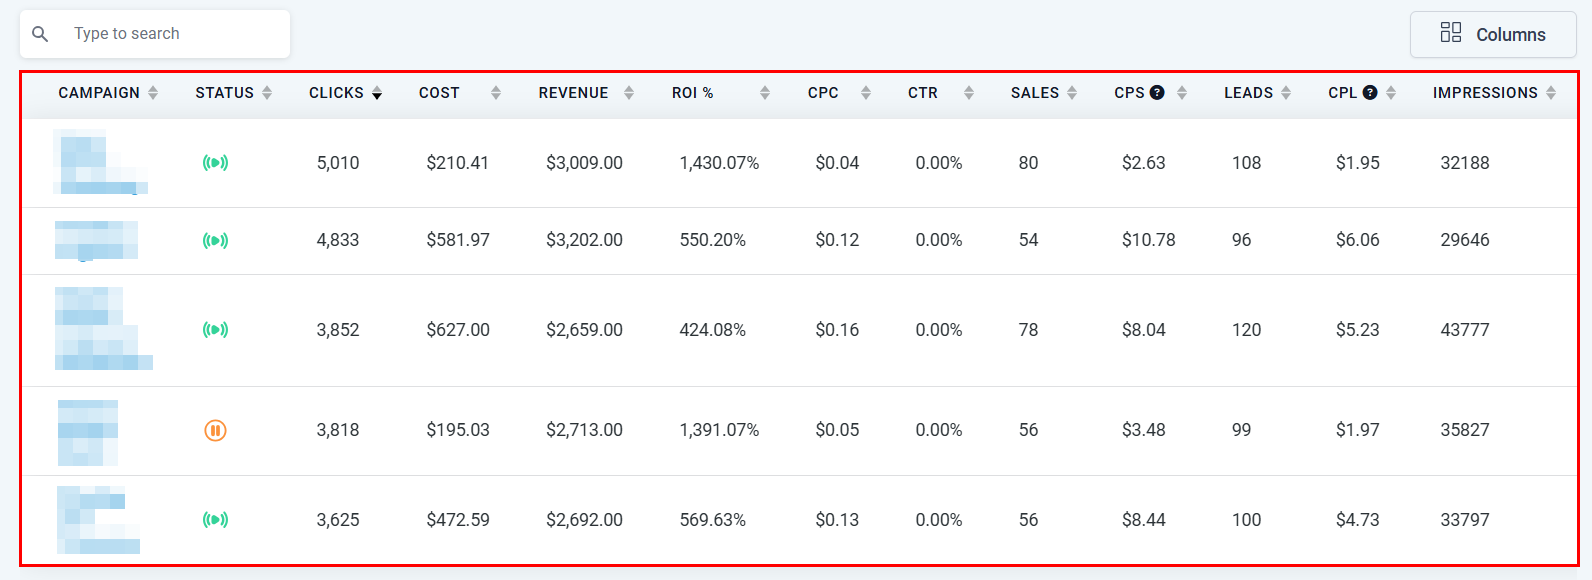
Top performing posts table ranked by engagement
Demographics report (Instagram)
For connected Instagram accounts with at least 100 followers, the Demographics section shows the age and gender distribution of your audience. This is useful for validating that the audience you are building matches the customer profile you are targeting.Data freshness and platform delays
Social analytics data does not always appear instantly after publishing. Known delays by platform:Export functionality for social media analytics is not currently available directly from the dashboard. For offline reporting, take screenshots of the dashboard or manually record key metrics on a scheduled basis.
Using social analytics to improve performance
Use the data from the social analytics dashboard to answer these questions on a regular cadence:- Which platform is growing fastest? Compare follower trends across platforms to decide where to increase your content investment.
- Which content format drives the most engagement? Compare post-level metrics across video, image, and text posts on the same platform.
- Is posting frequency correlated with engagement? Use the post performance chart to see whether weeks with more posts also see higher engagement, or whether quality matters more than quantity.
- Are impressions translating to reach? A high impression-to-reach ratio means your existing audience is seeing your content repeatedly; a low ratio means you are reaching new users. Depending on your goal, either result could be positive.
Frequently asked questions
Why are some platforms missing from my analytics dashboard?
Why are some platforms missing from my analytics dashboard?
Only connected social accounts appear in the analytics dashboard. If a platform is missing, go to Marketing → Social Planner → Accounts and confirm that the account is connected and authorized. Reconnecting an expired OAuth session will restore data access.
Can I compare performance across two specific platforms side by side?
Can I compare performance across two specific platforms side by side?
Yes. Use the platform filter in the Engagement Stats section to select two platforms and view their metrics in the same chart. The filter allows multi-select for comparative analysis.
Why do my Instagram reach numbers look lower than expected?
Why do my Instagram reach numbers look lower than expected?
Instagram reach reflects unique accounts, not total impressions. If your content is being seen multiple times by the same followers, reach will be significantly lower than impressions. This is normal for small, highly engaged audiences.