

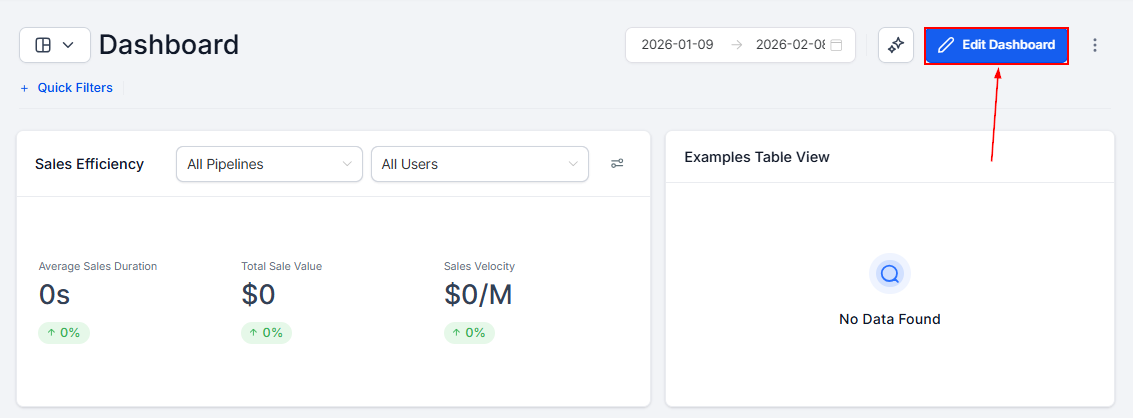
Click the pencil icon to enter edit mode
Widget categories
Browse widgets by category in the add widget panel
Contacts
Contacts
Appointments
Appointments
Opportunities
Opportunities
Visitor data
Visitor data
Emails
Emails
Calls
Calls
Conversations
Conversations
Payments
Payments
Meta Ads
Meta Ads
Google Analytics
Google Analytics
Custom Objects
Custom Objects
General
General
Individual widget types
Each widget category contains specific, pre-built widget types. Below is a reference of the widgets available across all categories:Supported chart types
Select the chart type that displays your data in the most useful way:- Numeric / Count
- Donut charts
- Line charts
- Bar charts
- Horizontal bar charts
- Tables
Supported metrics
For widgets that aggregate data, choose from these metric options:Adding a widget
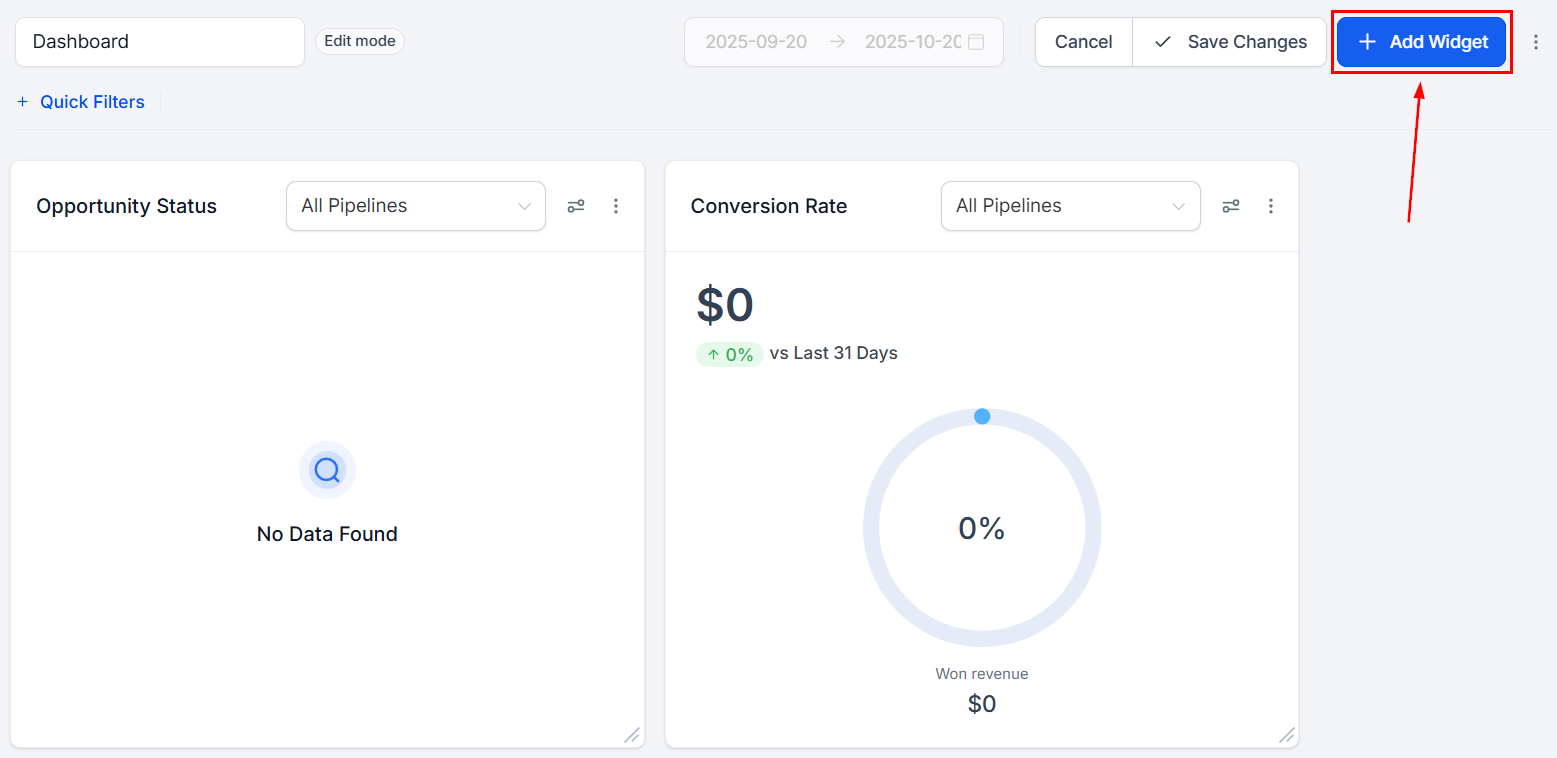
Enter edit mode
Select your widget
Customize the widget
Save
Widget configuration options
When configuring a widget in the Configure tab, you have access to these settings: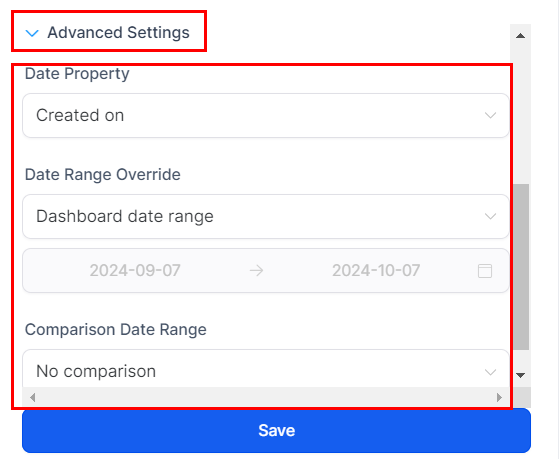
The Configure tab for customizing widget settings
Applying conditions
Use the Conditions tab to apply AND/OR filters to your widget data.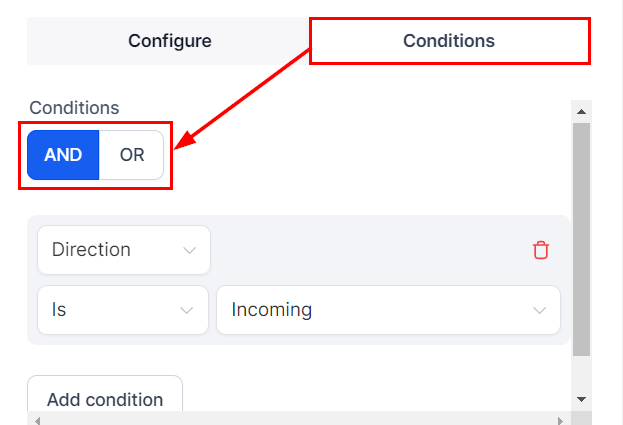
The Conditions tab for filtering widget data
Editing widgets
Enter edit mode
Open the widget menu
Make your changes
Removing a widget
Enter edit mode
Delete the widget
Save changes
Duplicating a widget
Enter edit mode
Duplicate
Save
Rearranging widgets
In edit mode, click and drag any widget to reposition it on the dashboard. Click Save Changes to lock in the new layout, or Cancel to revert.Resizing widgets
In edit mode, use the arrow icons at the corners of a widget to drag and resize it. Click Save Changes to confirm, or Cancel to undo.Specialized widget guides
Call widgets
Call widgets
Open edit mode
Add the widget
Configure
Conversation widgets
Conversation widgets
Open edit mode
Select the widget
Save
Task widget
Task widget
Appointment widgets
Appointment widgets
Opportunity date filter
Opportunity date filter
- Status Change — filter by the date the opportunity status last changed
- Created On — filter by when the opportunity was created
- Updated On — filter by when the opportunity was last updated
Lost reason filter for opportunity widgets
Lost reason filter for opportunity widgets
- In edit mode, click Add Widget and choose Lost Opportunities By Reason from the Opportunities section.
- In the Conditions tab, set Status IS Lost.
- Add a second condition for a specific Lost Reason if needed.
- Choose a Table chart type for an opportunities widget.
- Click Select Columns in the widget configuration.
- Enable the Lost Reason column and save.
Filtering by attribution and UTM parameters
Filtering by attribution and UTM parameters
- UTM Campaign, Campaign ID, Content, Keyword, Matchtype, Medium, Ad ID, Ad Group ID, Source
- Session Source and Medium (for grouping donut charts and line graphs)
- Add or edit a Contact or Opportunity widget.
- In the Conditions tab, click Add Condition and select Attribution.
- Choose First or Latest attribution.
- Click Add Attribution Fields and select the desired UTM property.
Filtering opportunity widgets by pipeline stages
Filtering opportunity widgets by pipeline stages
- In edit mode, add or select an Opportunity widget.
- In the Conditions tab, select Pipeline from the dropdown.
- Click + And and select Stage to filter by specific stages within that pipeline.
Custom Object widgets
Custom Object widgets
- Total — shows the total number of records for the object
- Count Over Time — tracks entry trends based on creation date
- Table View — displays records with custom fields and filters
Custom metrics
Custom metrics let you combine multiple metrics from different data sources, apply calculations, and display the results as a widget.Enter edit mode
Create a new metric
Fill in the details
Build the formula
Advanced settings
Create and add
Adding widgets from key pages
You can add widgets to your dashboard directly from these pages:- Call Report tab in the Reporting section
- Appointment Report tab in the Reporting section
- Opportunities tab in the Opportunities section
Embedding external content
You can embed external content — such as third-party dashboards, reports, or tools — directly into your HoopAI dashboard using iframe widgets.Enter edit mode
Add an embed widget
Paste the iframe URL
Save
Insight widgets from key pages
Add widgets to your dashboard directly from key reporting pages without manually configuring them:- Call Report tab — click the grid icon to send call metrics to a dashboard
- Appointment Report tab — click the grid icon to add appointment data
- Opportunities tab — use the three-dot menu to send opportunity widgets
Table chart widgets
Table widgets display your data in a sortable, columnar format — useful when you need to see individual records rather than aggregate charts. To create a table widget:- Add or edit a widget and select Table as the chart type
- Click Select Columns to choose which fields appear in the table
- Set sort order and row limits
- Save the widget
- Custom column selection (including custom fields and attribution data)
- Sorting by any column
- Click-through to granular insights for any row
- CSV export from the granular insights view
Frequently asked questions
Who can see and edit dashboard widgets?
Who can see and edit dashboard widgets?
How do I show only my data in a widget?
How do I show only my data in a widget?
Why is my widget not showing any data?
Why is my widget not showing any data?
Can I configure the timezone for widget data?
Can I configure the timezone for widget data?