

Accessing reports on mobile
- Open the HoopAI mobile app.
- Tap the App Drawer (swipe up or tap All Apps).
- Select Reports under the Insights and Productivity category.
Accessing reports from the mobile app drawer
Available reports on mobile
Pipeline report
The pipeline report shows your active sales pipeline broken down by stage. For each stage you can see:- Number of open opportunities
- Total value of opportunities in that stage
- Conversion rate from the previous stage
Revenue report
The revenue report tracks payments processed through the HoopAI platform over your selected date range. It shows:- Total revenue — sum of all completed payments
- Revenue by product or service — breakdown by catalog item
- Outstanding invoices — unpaid invoice totals
Conversation activity report
The conversation activity report provides a summary of messaging volume over time:- Total conversations opened
- Total messages sent and received
- Average response time
- Breakdown by channel (SMS, email, WhatsApp, Facebook)
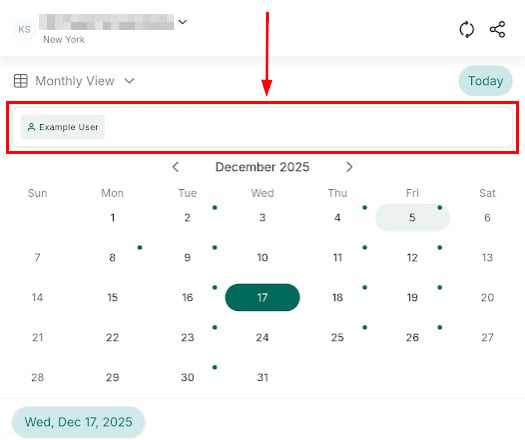
Appointment report
The appointment report shows:- Total appointments booked in the date range
- Appointments by calendar owner
- Show rate (attended vs. cancelled or no-showed)
- Upcoming vs. completed breakdown
Leads and contacts report
View how many new contacts entered your system over the selected period, where they came from (source attribution), and how many are attached to open opportunities.Dashboard summary widgets
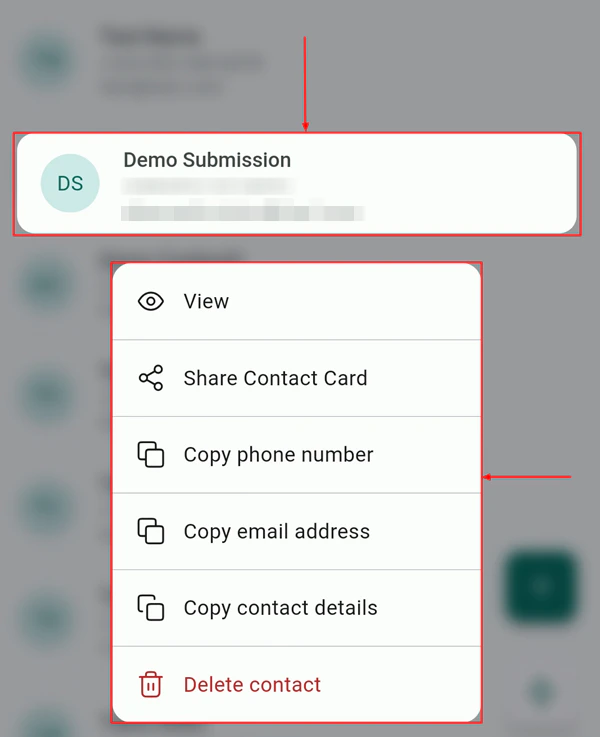
The mobile dashboard home screen always shows a condensed version of your key metrics in widget form:- Unread messages — jumps to filtered inbox
- Today’s appointments — count with one-tap navigation to calendar
- Tasks due — overdue and due-today count
- Pipeline value — total open opportunity value
Dashboard summary widgets showing key business metrics
Date range filtering
Most reports support the following date range options:- Today
- Yesterday
- Last 7 days
- This month
- Last month
- Custom range (date picker)
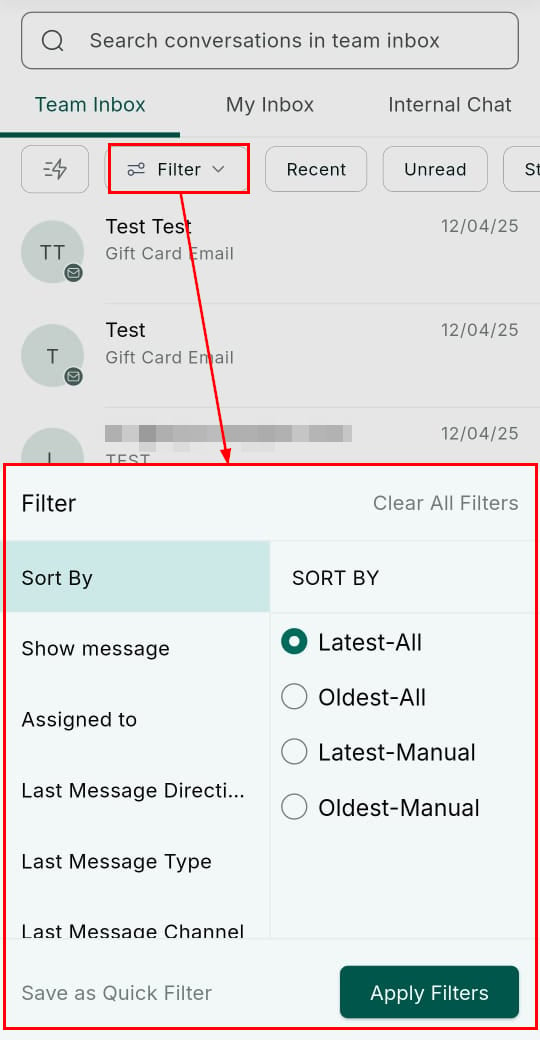
Date range filter on a mobile report
What is not available on mobile
The following reporting features are only accessible on the desktop platform:- Custom dashboard builder — creating, arranging, and configuring chart widgets requires desktop
- Custom metric definitions — building new calculated metrics from scratch
- Google Analytics widgets — requires desktop for setup, though data syncs to your dashboard
- Snapshot sharing of custom reports — configuring and exporting snapshots is a desktop workflow
- Advanced attribution reports — full multi-touch attribution and ad spend reporting