

Accessing workflow statistics
- Navigate to Automation in the HoopAI platform.
- On the Workflows list page, find the workflow you want to review.
- Click the expand button (accordion arrow) next to the workflow name.
- Click the Stats button that appears.
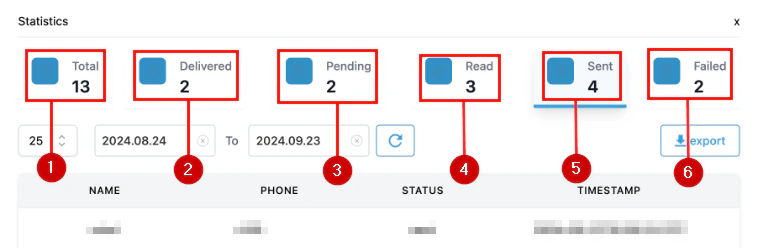
The Statistics panel showing delivery metrics with totals, status filters, and export option
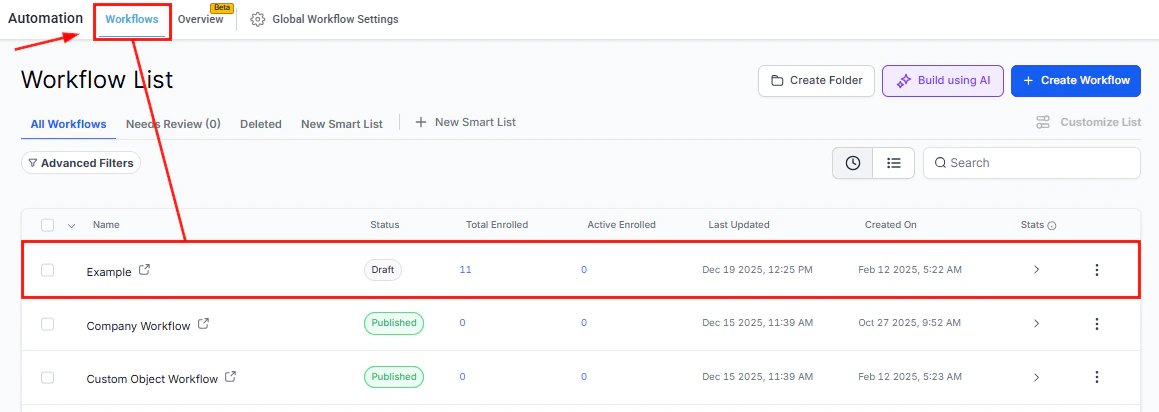
The Workflow List page with the Stats column visible for each workflow
What the stats panel shows
The Stats view focuses on communication channel performance. For each email or SMS action in the workflow, you can see metrics such as: Email metrics:- Sent — the total number of emails sent from that action
- Delivered — the number that reached the recipient’s inbox
- Opened — how many recipients opened the email (open rate)
- Clicked — how many clicked a link within the email (click rate)
- Unsubscribed — the number of recipients who opted out
- Bounced — messages that failed to deliver due to invalid addresses or server rejections
- Spam reported — recipients who marked the message as spam
- Sent — the total number of messages sent
- Delivered — confirmed deliveries to the recipient’s device
- Failed — messages that could not be delivered
Data availability and history
Workflow statistics include data going back to January 1, 2023. If you are reviewing a workflow that was built before that date, metrics will be available from that cutoff forward. If you have removed an email or SMS action from a workflow, its historical statistics are still included in the stats panel. You will see the data for that action alongside currently active actions. This ensures you have a complete picture of the workflow’s communication history even after edits.Comparing workflows
The Stats button is available for each individual workflow on the list page. Because you can expand multiple workflows and view their stats without opening the full builder, it becomes straightforward to compare email open rates or SMS delivery rates across different nurture sequences side by side. This is particularly useful when A/B testing message timing — for example, comparing a workflow that sends a follow-up after 1 day versus one that sends after 3 days.Using statistics to optimize workflows
Low open rates typically indicate subject line issues (for email) or send-time problems. Check whether the time window setting is delivering messages during hours when contacts are likely to be active. Review subject line copy and test variations. High bounce rates suggest list quality issues. Contacts with invalid email addresses should be cleaned from the CRM, or a validation step should be added earlier in the workflow to filter out addresses that are likely undeliverable. High unsubscribe rates often mean the message content does not match the contact’s expectations, the frequency is too high, or contacts are receiving the workflow in error. Review the enrollment trigger and filters to ensure only appropriate contacts are entering the workflow. Low SMS delivery rates may indicate carrier filtering of the message content, phone number issues, or contacts with landlines stored as their primary phone. Review message content for trigger words and verify contact data quality. High click rates with low conversion (when you can track downstream conversion separately) point to a landing page or offer issue rather than a workflow issue. The automation is working, but what happens after the click needs attention.Step-level analysis
For a more granular view of how contacts move through each step — including how many contacts are currently waiting at each action and how many have completed or exited — refer to the Enrollment History tab within the workflow. While Workflow Statistics focuses on message delivery and engagement, Enrollment History shows the flow of contacts through the workflow structure itself.FAQs
Can I view statistics for a workflow folder instead of an individual workflow?
Can I view statistics for a workflow folder instead of an individual workflow?
No. Statistics are available only at the individual workflow level. Folder-level aggregation is not currently supported.
How often are the statistics updated?
How often are the statistics updated?
Statistics refresh in near real time as events are recorded. There may be a short delay of a few minutes between when an event occurs (such as an email open) and when it appears in the stats panel.
Can I export workflow statistics to a spreadsheet?
Can I export workflow statistics to a spreadsheet?
Direct export from the workflow stats panel is not currently available. For custom reporting, use the Analytics Dashboard in the HoopAI platform, which supports broader metric exports and custom date range filtering.
Why do some email actions show zero stats?
Why do some email actions show zero stats?
An action that has never been executed for any contact will show zero across all metrics. Check the enrollment history to confirm contacts are reaching that step, and verify the workflow is published and the trigger is active.