> ## Documentation Index
> Fetch the complete documentation index at: https://help.hoopai.com/llms.txt
> Use this file to discover all available pages before exploring further.
# Sites analytics dashboard
> Track page views, opt-in rates, bounce rates, and conversions across funnels, websites, blogs, forms, surveys, QR codes, and webinars.
The Sites Analytics Dashboard gives you a unified view of performance across all your funnels, websites, QR codes, forms, surveys, and webinars. Use it to identify what is working, where visitors drop off, and how to increase conversions.
 ## Accessing the analytics dashboard
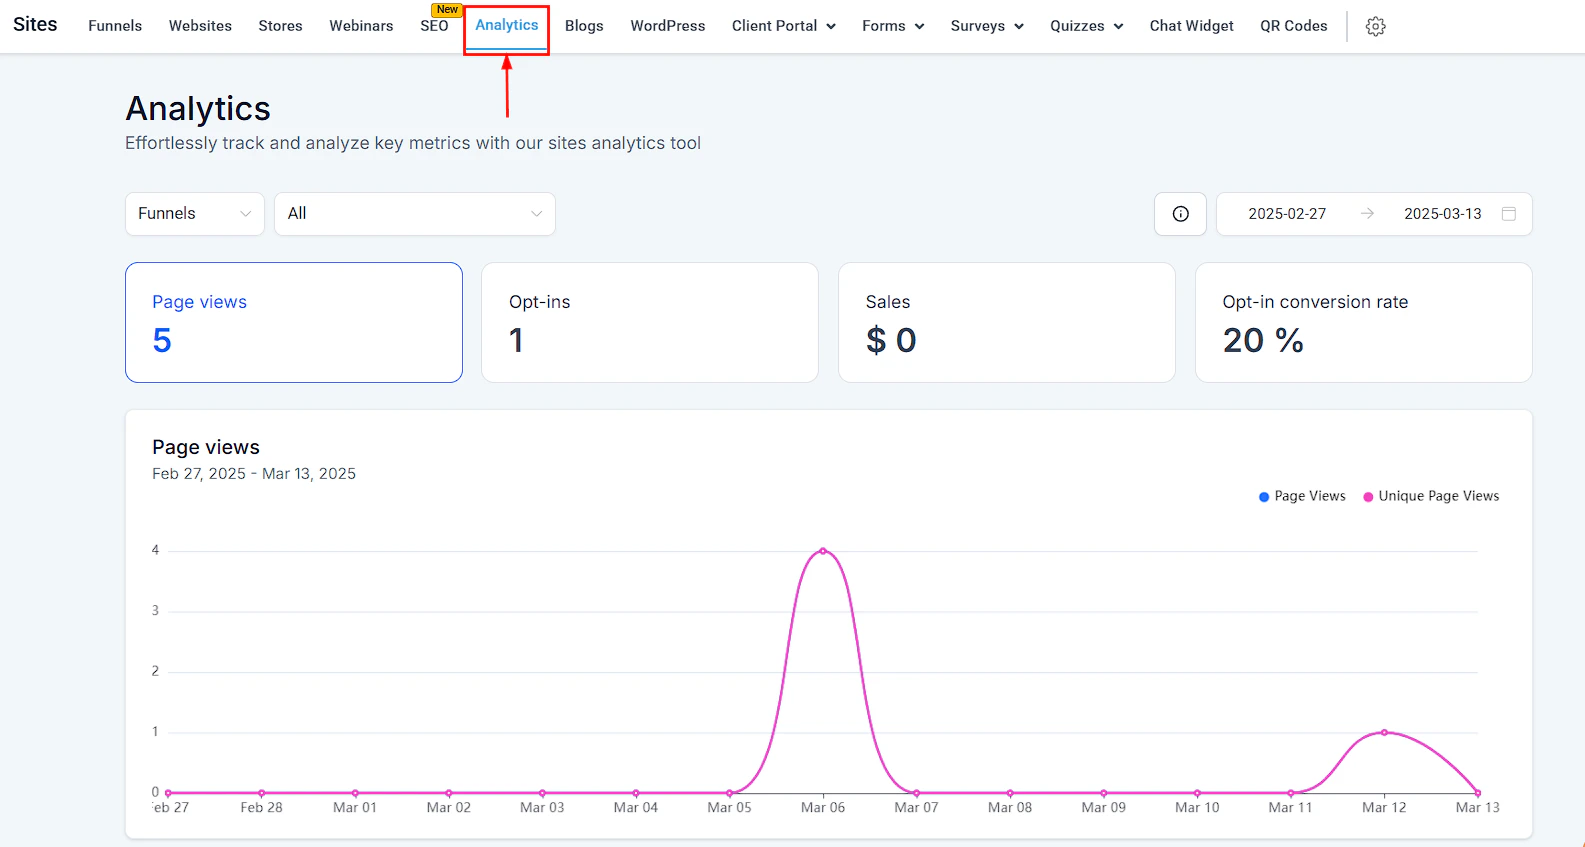
Navigate to **Sites** in the left sidebar, then click **Analytics**.
***
## Filtering the data
* **Source** — use the dropdown to select the asset type: Funnels, Websites, QR Codes, Forms, Surveys, or Webinars. A second dropdown lets you view all assets of that type or select a specific one.
* **Date Range** — select a custom date range to filter all metrics to that period.
***
## Metrics for funnels and websites
| Metric | Description |
| -------------------------- | ------------------------------------------------------------ |
| **Page Views — All** | Total page loads including return visits |
| **Page Views — Unique** | Loads from first-time visitors only |
| **Opt-ins** | Conversions: form submissions, bookings, or purchases |
| **Sales** | Total revenue generated |
| **Opt-in Conversion Rate** | Opt-ins divided by unique page views (%) |
| **Average Time on Site** | Total time spent by all users divided by total sessions |
| **Bounce Rate** | Percentage of sessions where the user left within 30 seconds |
### Page viewing behavior
The charts below the summary metrics show:
* **Page Views by page** — traffic breakdown per funnel step or website page
* **Top Browsers** — top 10 browsers used by visitors
* **Top Client IPs** — top 10 IP addresses; useful for spotting bot traffic
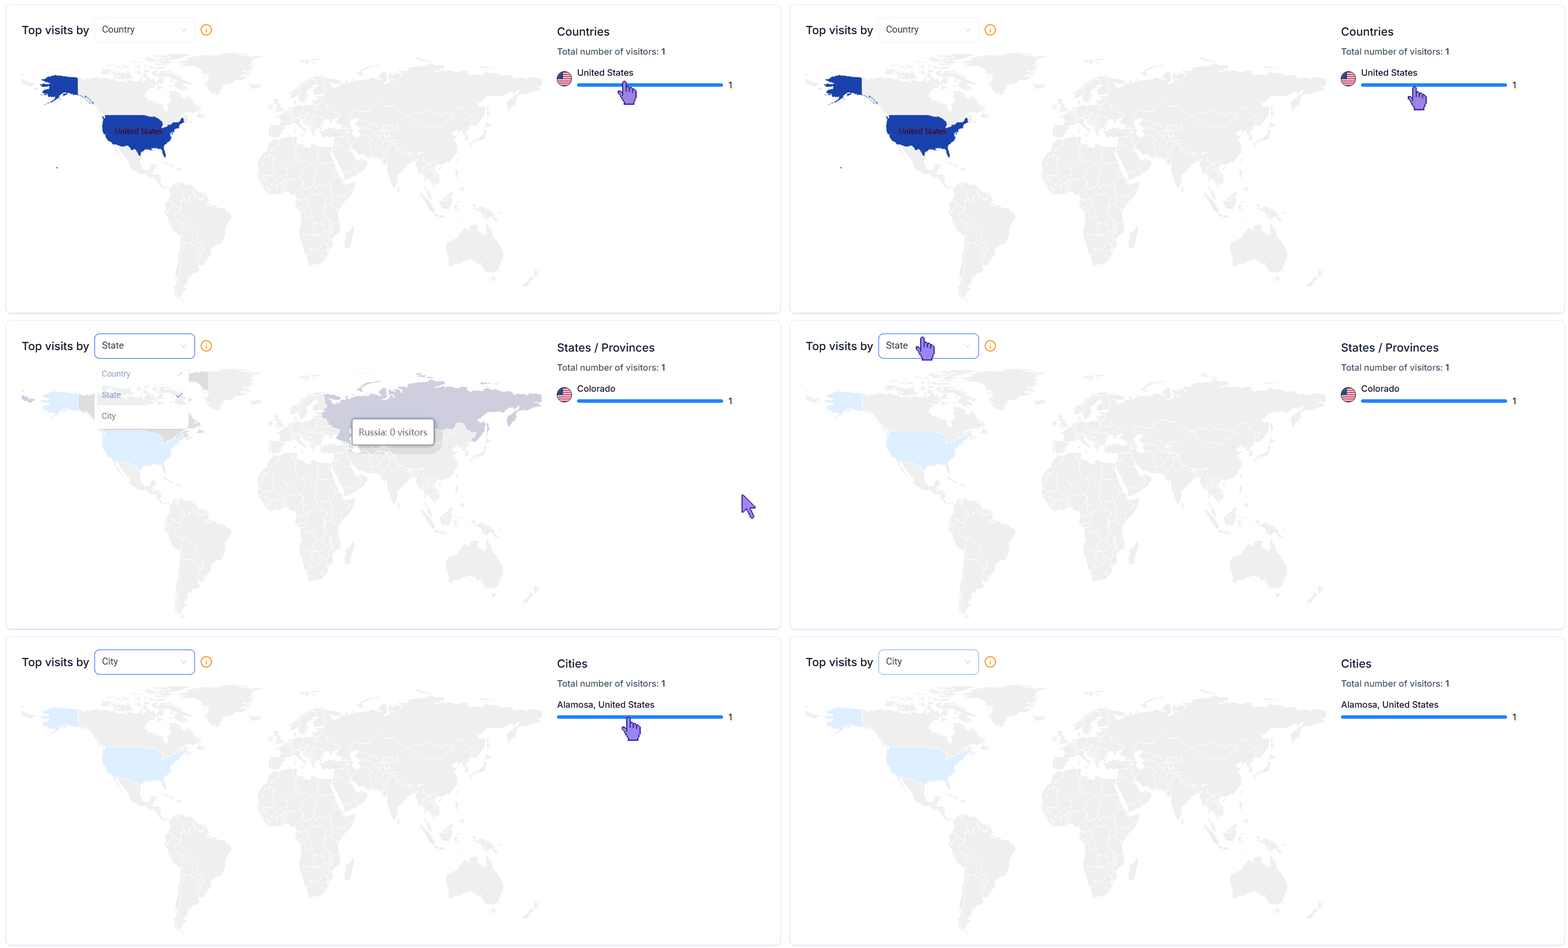
* **Top Visits** — geographic heatmap showing traffic by country, state, and city
* **Acquisition Data** — which channels are driving new visitors daily
* **Traffic By Device Type** — split between mobile, desktop, and tablet
## Accessing the analytics dashboard
Navigate to **Sites** in the left sidebar, then click **Analytics**.
***
## Filtering the data
* **Source** — use the dropdown to select the asset type: Funnels, Websites, QR Codes, Forms, Surveys, or Webinars. A second dropdown lets you view all assets of that type or select a specific one.
* **Date Range** — select a custom date range to filter all metrics to that period.
***
## Metrics for funnels and websites
| Metric | Description |
| -------------------------- | ------------------------------------------------------------ |
| **Page Views — All** | Total page loads including return visits |
| **Page Views — Unique** | Loads from first-time visitors only |
| **Opt-ins** | Conversions: form submissions, bookings, or purchases |
| **Sales** | Total revenue generated |
| **Opt-in Conversion Rate** | Opt-ins divided by unique page views (%) |
| **Average Time on Site** | Total time spent by all users divided by total sessions |
| **Bounce Rate** | Percentage of sessions where the user left within 30 seconds |
### Page viewing behavior
The charts below the summary metrics show:
* **Page Views by page** — traffic breakdown per funnel step or website page
* **Top Browsers** — top 10 browsers used by visitors
* **Top Client IPs** — top 10 IP addresses; useful for spotting bot traffic
* **Top Visits** — geographic heatmap showing traffic by country, state, and city
* **Acquisition Data** — which channels are driving new visitors daily
* **Traffic By Device Type** — split between mobile, desktop, and tablet
 ### Video engagement metrics
If your pages include embedded videos, the dashboard tracks:
| Metric | Description |
| ---------------------- | -------------------------------------------------------- |
| **Average Watch Time** | Average percentage of the video watched per viewer |
| **Drop-off Spike** | Points in the video where the most viewers stop watching |
| **Video Play** | Number of times the video was started |
| **Video Pauses** | How frequently viewers pause the video |
| **Completion** | Percentage of viewers who watch to the end |
### Video engagement metrics
If your pages include embedded videos, the dashboard tracks:
| Metric | Description |
| ---------------------- | -------------------------------------------------------- |
| **Average Watch Time** | Average percentage of the video watched per viewer |
| **Drop-off Spike** | Points in the video where the most viewers stop watching |
| **Video Play** | Number of times the video was started |
| **Video Pauses** | How frequently viewers pause the video |
| **Completion** | Percentage of viewers who watch to the end |
 ***
## Metrics for QR codes
* **Total Scans** — all scans of the selected QR code
* **Unique Scans** — first-time scans only
* Breakdown by individual QR code name, type, and total scan count
***
## Metrics for webinars
| Metric | Description |
| ----------------- | -------------------------------------------------------------- |
| **Page Views** | Total and unique visits to the webinar registration page |
| **Registrations** | Total number of sign-ups |
| **Recurring** | Total registrations across all sessions for recurring webinars |
### Recurring webinar metrics
The **Recurring** view shows a session-level breakdown for recurring webinars:
| Metric | Description |
| ----------------------- | --------------------------------------------------------- |
| **Total Registrations** | All sign-ups for the webinar across all sessions |
| **Total Attendees** | Registered users who actually joined a live session |
| **Repeat Attendees** | Users who attended more than one session |
| **Avg Attendance** | Average number of participants across sessions |
| **Avg Conversion %** | Average percentage of attendees who completed a goal |
| **Sessions** | Total number of webinar broadcasts in the selected period |
***
## Metrics for QR codes
* **Total Scans** — all scans of the selected QR code
* **Unique Scans** — first-time scans only
* Breakdown by individual QR code name, type, and total scan count
***
## Metrics for webinars
| Metric | Description |
| ----------------- | -------------------------------------------------------------- |
| **Page Views** | Total and unique visits to the webinar registration page |
| **Registrations** | Total number of sign-ups |
| **Recurring** | Total registrations across all sessions for recurring webinars |
### Recurring webinar metrics
The **Recurring** view shows a session-level breakdown for recurring webinars:
| Metric | Description |
| ----------------------- | --------------------------------------------------------- |
| **Total Registrations** | All sign-ups for the webinar across all sessions |
| **Total Attendees** | Registered users who actually joined a live session |
| **Repeat Attendees** | Users who attended more than one session |
| **Avg Attendance** | Average number of participants across sessions |
| **Avg Conversion %** | Average percentage of attendees who completed a goal |
| **Sessions** | Total number of webinar broadcasts in the selected period |
 ***
## Metrics for blogs
| Metric | Description |
| ------------------------ | ----------------------------------------------------- |
| **Page Views** | Total and unique visits to your blog pages |
| **Published Blog Sites** | Total number of blog sites you have created |
| **Published Posts** | Total number of blog posts published across all sites |
The blog analytics view also shows a page views graph over time, device breakdown (mobile, desktop, tablet), and a count of manually created versus imported blog posts.
***
## Metrics for forms and surveys
| Metric | Description |
| ------------------- | ------------------------------------------------------------------- |
| **Total Views** | Total number of times the form or survey was accessed |
| **Responses** | Number of completed submissions |
| **Average Time** | Average time users spend filling out the form or survey |
| **Completion Rate** | Percentage of users who complete the form versus those who start it |
A graph view shows trends over the selected date range, and a table lists each form or survey by name, last-updated date, and total view count.
***
## Metrics for external tracking
If you have external tracking set up, the **External Tracking** option appears in the Source dropdown. Select it to view data for your external domains, pages, or forms. Navigate the sections the same way as for funnels, websites, and forms.
The **External Tracking** option appears in the Source dropdown only when an external tracking script is connected to your account.
Check the **Drop-off Spike** metric for any video on a high-traffic page. A spike at a consistent timestamp usually indicates a confusing transition, a long pause, or content that does not match visitor expectations. Editing that section often leads to a meaningful increase in completion rates.
***
## Metrics for blogs
| Metric | Description |
| ------------------------ | ----------------------------------------------------- |
| **Page Views** | Total and unique visits to your blog pages |
| **Published Blog Sites** | Total number of blog sites you have created |
| **Published Posts** | Total number of blog posts published across all sites |
The blog analytics view also shows a page views graph over time, device breakdown (mobile, desktop, tablet), and a count of manually created versus imported blog posts.
***
## Metrics for forms and surveys
| Metric | Description |
| ------------------- | ------------------------------------------------------------------- |
| **Total Views** | Total number of times the form or survey was accessed |
| **Responses** | Number of completed submissions |
| **Average Time** | Average time users spend filling out the form or survey |
| **Completion Rate** | Percentage of users who complete the form versus those who start it |
A graph view shows trends over the selected date range, and a table lists each form or survey by name, last-updated date, and total view count.
***
## Metrics for external tracking
If you have external tracking set up, the **External Tracking** option appears in the Source dropdown. Select it to view data for your external domains, pages, or forms. Navigate the sections the same way as for funnels, websites, and forms.
The **External Tracking** option appears in the Source dropdown only when an external tracking script is connected to your account.
Check the **Drop-off Spike** metric for any video on a high-traffic page. A spike at a consistent timestamp usually indicates a confusing transition, a long pause, or content that does not match visitor expectations. Editing that section often leads to a meaningful increase in completion rates.