> ## Documentation Index
> Fetch the complete documentation index at: https://help.hoopai.com/llms.txt
> Use this file to discover all available pages before exploring further.
# Review reporting and analytics
> Track review performance, rating trends, sentiment changes, invite volume, and platform-level breakdowns from the HoopAI platform's reputation analytics dashboard.
The HoopAI platform provides a built-in analytics dashboard that tracks every measurable aspect of your reputation management efforts — from the number of review requests sent to average star rating trends over time. Understanding these metrics helps you identify what is working, where to focus effort, and how your reputation compares to competitors.
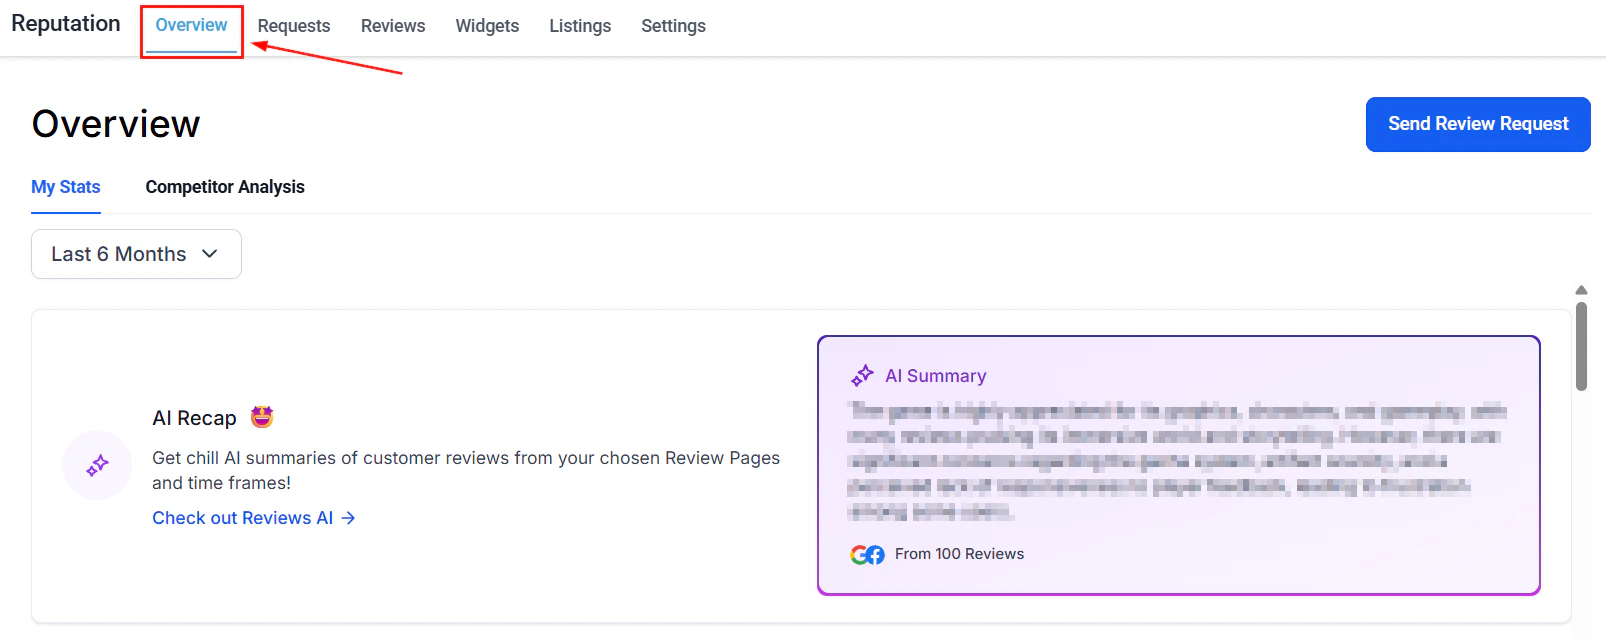
Access the analytics dashboard at **Reputation > Overview**.
 ***
## Dashboard overview
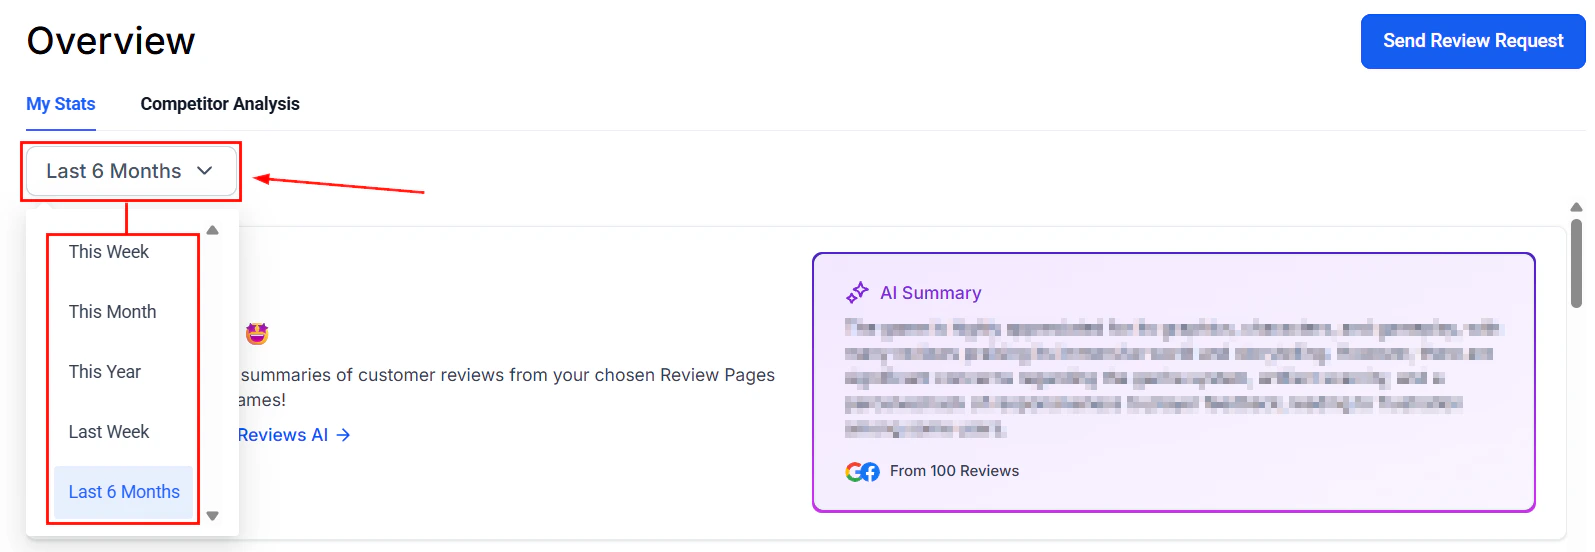
The Reputation Overview is divided into several reporting sections. All sections respond to the **date range selector** at the top of the page — change the date range to filter every metric to a specific period.
***
## Reviews received
The Reviews Received tile shows the total number of reviews your business collected in the selected date range, along with a percentage change compared to the previous equivalent period.
| Metric | What it shows |
| ------------------------- | ---------------------------------------------------------------------- |
| Total reviews received | Count of all reviews across connected platforms in the selected period |
| Period-over-period change | Percentage increase or decrease compared to the prior matching period |
| Platform breakdown | Which portion of reviews came from Google vs. Facebook |
***
## Dashboard overview
The Reputation Overview is divided into several reporting sections. All sections respond to the **date range selector** at the top of the page — change the date range to filter every metric to a specific period.
***
## Reviews received
The Reviews Received tile shows the total number of reviews your business collected in the selected date range, along with a percentage change compared to the previous equivalent period.
| Metric | What it shows |
| ------------------------- | ---------------------------------------------------------------------- |
| Total reviews received | Count of all reviews across connected platforms in the selected period |
| Period-over-period change | Percentage increase or decrease compared to the prior matching period |
| Platform breakdown | Which portion of reviews came from Google vs. Facebook |
 Use this metric to evaluate whether your review collection efforts are producing growth over time. A consistent upward trend indicates healthy outreach activity; a plateau or decline often signals that automated requests need to be re-enabled or that workflows need adjustment.
***
## Average review rating
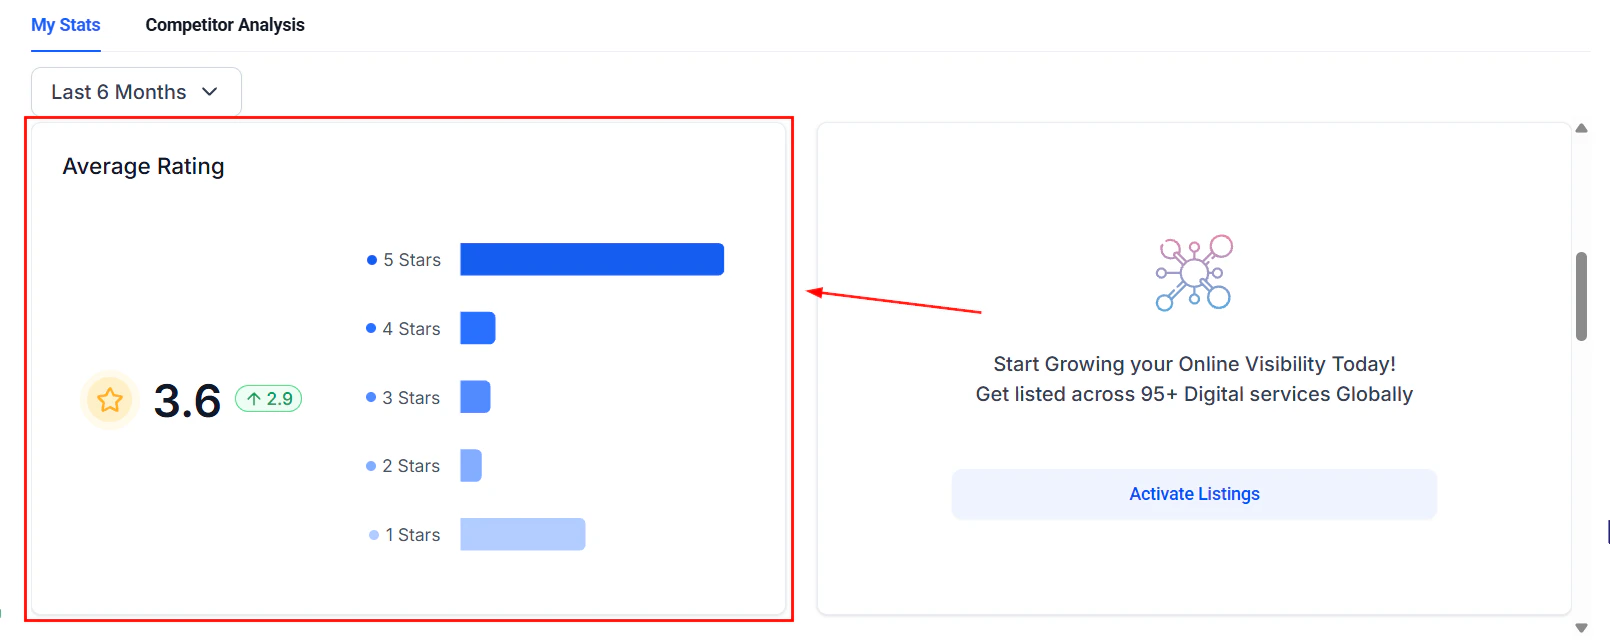
The Average Review Rating section displays a graphical representation of your rating over the selected period, including the overall average score and a percentage indicator showing whether ratings improved or declined.
This view helps you:
* Spot rating dips that correlate with specific dates or operational changes
* Verify that a surge in review volume is not accompanied by a drop in quality
* Set internal benchmarks (e.g., maintaining a minimum 4.5-star average)
Cross-reference your average rating trend with your invite volume. A sudden drop in rating following a request campaign may indicate that a particular customer segment was less satisfied than expected.
***
## Review sentiment
Review sentiment classifies your reviews as positive (4 stars or above) or negative (3 stars or below) and shows the percentage change in each category compared to the prior period.
| Rating | Classified as |
| --------- | ------------------ |
| 4–5 stars | Positive sentiment |
| 1–3 stars | Negative sentiment |
Track sentiment alongside total review volume to understand whether growth in review count is driven by satisfied or dissatisfied customers. A spike in negative sentiment is an early warning indicator that warrants investigation into recent customer experience changes.
***
## Invite trends
The Invite Trends graph displays the number of review requests sent over time, giving you a clear view of your outreach activity and its consistency.
Use this metric to evaluate whether your review collection efforts are producing growth over time. A consistent upward trend indicates healthy outreach activity; a plateau or decline often signals that automated requests need to be re-enabled or that workflows need adjustment.
***
## Average review rating
The Average Review Rating section displays a graphical representation of your rating over the selected period, including the overall average score and a percentage indicator showing whether ratings improved or declined.
This view helps you:
* Spot rating dips that correlate with specific dates or operational changes
* Verify that a surge in review volume is not accompanied by a drop in quality
* Set internal benchmarks (e.g., maintaining a minimum 4.5-star average)
Cross-reference your average rating trend with your invite volume. A sudden drop in rating following a request campaign may indicate that a particular customer segment was less satisfied than expected.
***
## Review sentiment
Review sentiment classifies your reviews as positive (4 stars or above) or negative (3 stars or below) and shows the percentage change in each category compared to the prior period.
| Rating | Classified as |
| --------- | ------------------ |
| 4–5 stars | Positive sentiment |
| 1–3 stars | Negative sentiment |
Track sentiment alongside total review volume to understand whether growth in review count is driven by satisfied or dissatisfied customers. A spike in negative sentiment is an early warning indicator that warrants investigation into recent customer experience changes.
***
## Invite trends
The Invite Trends graph displays the number of review requests sent over time, giving you a clear view of your outreach activity and its consistency.
 Use invite trends to:
* Confirm that automated workflows are firing on schedule
* Identify gaps in outreach (days or weeks with no requests sent)
* Correlate request volume with subsequent review volume — expect reviews to follow invites with a typical lag of 24–72 hours
### Invite goals
The platform automatically sets incremental invite goals based on your sending history. As you consistently send more requests, goals increase to keep pushing your outreach forward. These progressive targets are visible in the **Invite Goals** section of the dashboard.
***
## Review trends
The Review Trends graph shows the number of reviews received over the selected period, displayed as a time-series chart.
Use invite trends to:
* Confirm that automated workflows are firing on schedule
* Identify gaps in outreach (days or weeks with no requests sent)
* Correlate request volume with subsequent review volume — expect reviews to follow invites with a typical lag of 24–72 hours
### Invite goals
The platform automatically sets incremental invite goals based on your sending history. As you consistently send more requests, goals increase to keep pushing your outreach forward. These progressive targets are visible in the **Invite Goals** section of the dashboard.
***
## Review trends
The Review Trends graph shows the number of reviews received over the selected period, displayed as a time-series chart.
 Use this view to:
* Identify which days or weeks generate the highest review volume
* Understand the lag between invite sends and review submissions
* Spot seasonal patterns in review activity
***
## Rating by source
The Rating by Source breakdown compares your average rating and review volume across each connected platform — Google and Facebook — side by side.
This is useful for identifying if one platform significantly underperforms the other, which may indicate that a different customer segment uses each platform or that reviews on one platform skew more critical. You can then adjust your review link balance ratio in **Reputation > Settings** to increase request volume to the platform where you need improvement.
***
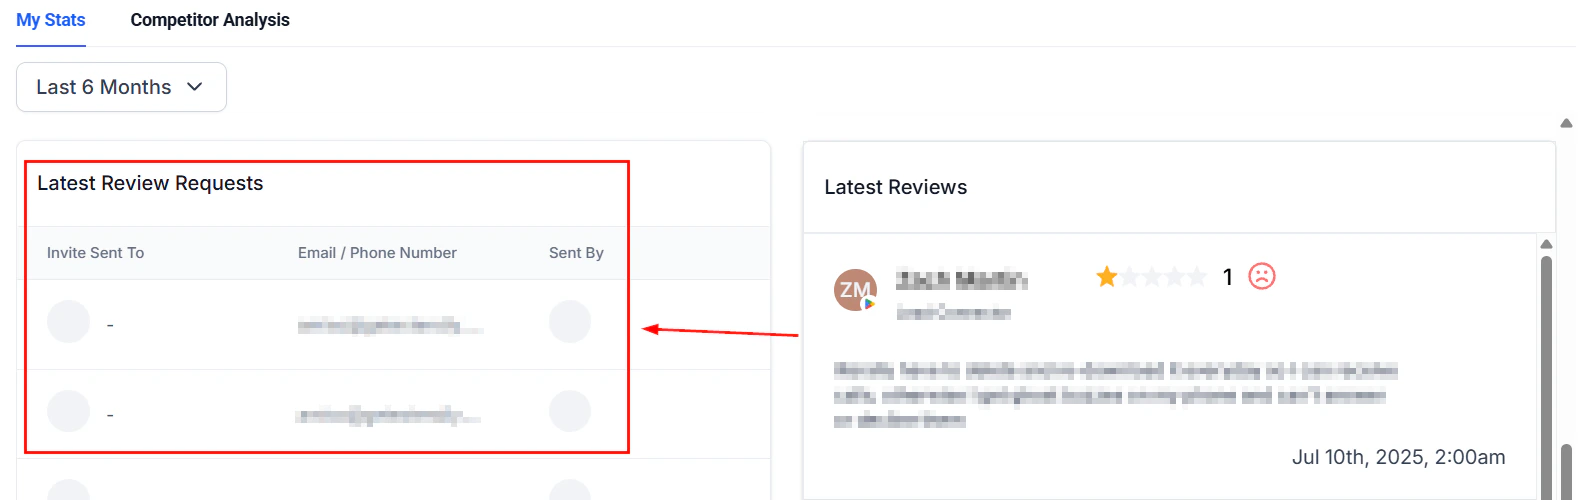
## Latest review requests
This section shows a list of the most recent review requests sent, including:
* Recipient name
* Contact method used (email, SMS, or WhatsApp)
* Date the request was sent
* Delivery status (Queued, Sent, Delivered, or Failed)
Use this view to spot failed requests that may need to be resent, or to confirm that recent workflow-triggered requests are being dispatched correctly.
***
## Latest reviews
The Latest Reviews list shows the most recently submitted reviews across all connected platforms, with star rating, platform source, date, and review text. This gives you a real-time pulse on incoming feedback without needing to navigate to the full Reviews tab.
***
## Exporting and sharing reporting data
For deeper analysis or to share reputation metrics with clients or team members, you can combine the Reputation dashboard data with the broader Reporting module:
* Navigate to **Reporting > Reputation** for additional reporting views
* Use date range filters to isolate specific campaign periods
* Screenshot or screen-record the dashboard for client reporting presentations
All reputation reporting data is scoped to the connected platforms (Google Business Profile and Facebook Page). Manually added reviews from other platforms do appear in your Reviews tab and widget but are not included in trend analytics.
***
## FAQs
The average rating is calculated across all reviews received from connected platforms (Google and Facebook) within the selected date range. Manually added reviews are not included in the rating calculation.
The percentage change compares the current selected period to an equivalent prior period of the same length. For example, if you select the last 30 days, the comparison is against the 30 days before that.
This can happen when a review request campaign generates responses over a longer period than expected, when a review goes viral on a platform, or when a business event (positive or negative) drives organic review activity without a triggered request.
The Requests tab (Reputation > Requests) includes a "Sent by" column that identifies which team member dispatched each request. For aggregate team performance, use the date range and filter options to isolate a specific user's activity.
Review data from connected platforms syncs continuously. Dashboard metrics reflect near-real-time data, though there may be a short delay of up to a few minutes for very recently posted reviews.
Use this view to:
* Identify which days or weeks generate the highest review volume
* Understand the lag between invite sends and review submissions
* Spot seasonal patterns in review activity
***
## Rating by source
The Rating by Source breakdown compares your average rating and review volume across each connected platform — Google and Facebook — side by side.
This is useful for identifying if one platform significantly underperforms the other, which may indicate that a different customer segment uses each platform or that reviews on one platform skew more critical. You can then adjust your review link balance ratio in **Reputation > Settings** to increase request volume to the platform where you need improvement.
***
## Latest review requests
This section shows a list of the most recent review requests sent, including:
* Recipient name
* Contact method used (email, SMS, or WhatsApp)
* Date the request was sent
* Delivery status (Queued, Sent, Delivered, or Failed)
Use this view to spot failed requests that may need to be resent, or to confirm that recent workflow-triggered requests are being dispatched correctly.
***
## Latest reviews
The Latest Reviews list shows the most recently submitted reviews across all connected platforms, with star rating, platform source, date, and review text. This gives you a real-time pulse on incoming feedback without needing to navigate to the full Reviews tab.
***
## Exporting and sharing reporting data
For deeper analysis or to share reputation metrics with clients or team members, you can combine the Reputation dashboard data with the broader Reporting module:
* Navigate to **Reporting > Reputation** for additional reporting views
* Use date range filters to isolate specific campaign periods
* Screenshot or screen-record the dashboard for client reporting presentations
All reputation reporting data is scoped to the connected platforms (Google Business Profile and Facebook Page). Manually added reviews from other platforms do appear in your Reviews tab and widget but are not included in trend analytics.
***
## FAQs
The average rating is calculated across all reviews received from connected platforms (Google and Facebook) within the selected date range. Manually added reviews are not included in the rating calculation.
The percentage change compares the current selected period to an equivalent prior period of the same length. For example, if you select the last 30 days, the comparison is against the 30 days before that.
This can happen when a review request campaign generates responses over a longer period than expected, when a review goes viral on a platform, or when a business event (positive or negative) drives organic review activity without a triggered request.
The Requests tab (Reputation > Requests) includes a "Sent by" column that identifies which team member dispatched each request. For aggregate team performance, use the date range and filter options to isolate a specific user's activity.
Review data from connected platforms syncs continuously. Dashboard metrics reflect near-real-time data, though there may be a short delay of up to a few minutes for very recently posted reviews.