> ## Documentation Index
> Fetch the complete documentation index at: https://help.hoopai.com/llms.txt
> Use this file to discover all available pages before exploring further.
# Funnel Reports
> Analyze lead-to-close conversion rates at every pipeline stage using funnel reports in the HoopAI Platform.
Funnel Reports give you a stage-by-stage view of how leads move through your sales pipelines. By understanding where prospects drop off, you can identify bottlenecks, coach agents on weak stages, and increase overall conversion rates.
## Accessing funnel data
Funnel conversion data is available in two places:
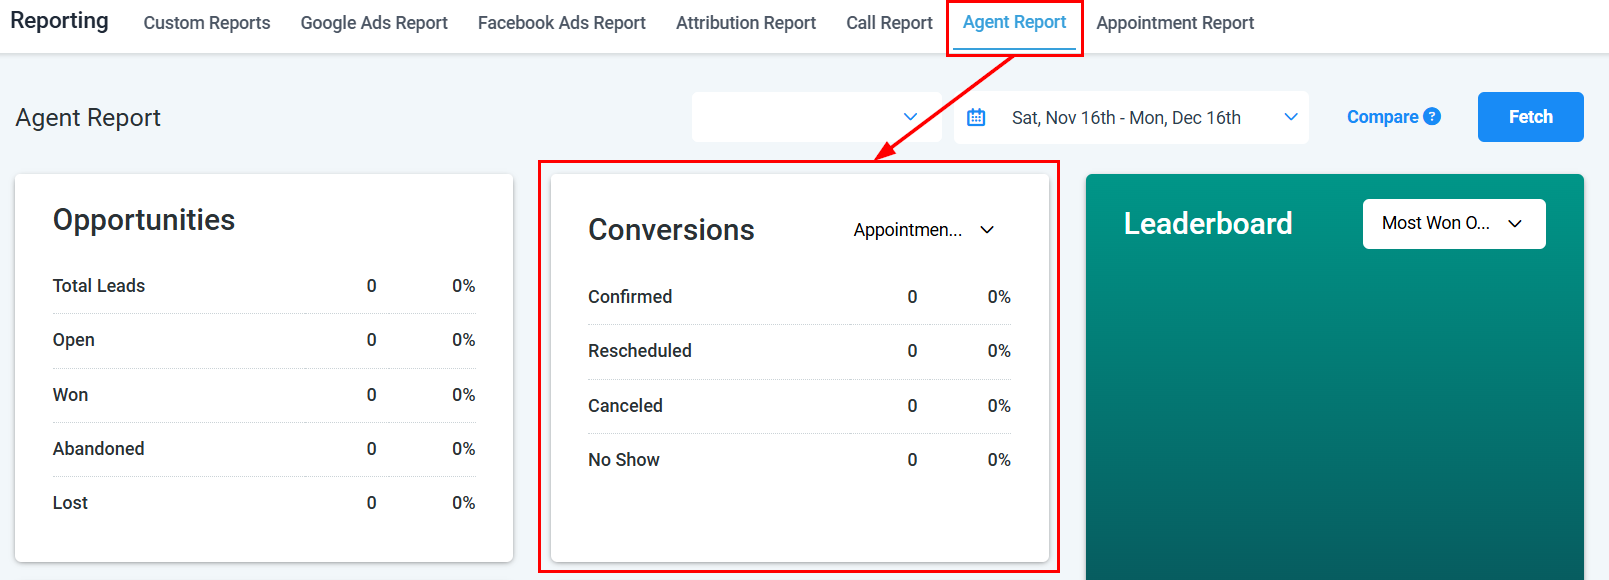
* **Reporting → Agent Reporting → Conversions** — per-agent funnel view by pipeline and stage
* **CRM → Pipelines** — overall pipeline view showing opportunities at each stage
 ***
## Reading a funnel report
A funnel report shows the number and percentage of opportunities at each stage of your pipeline, from initial entry to close. The key data points are:
| Data point | Description |
| ------------------------- | --------------------------------------------------------------------------- |
| **Stage name** | The pipeline stage label (e.g., New Lead, Qualified, Proposal Sent) |
| **Count** | Number of opportunities currently at or that have passed through this stage |
| **Conversion rate** | Percentage of opportunities that moved from this stage to the next |
| **Drop-off rate** | Percentage of opportunities lost at this stage |
| **Average time in stage** | How long opportunities typically remain before advancing or closing |
***
## Pipeline filters
Use the filters in the Conversions section of Agent Reporting to focus your analysis:
* **Pipeline** — select a specific pipeline to analyze
* **Stages** — choose which stages to include in the funnel view
* **User** — filter by agent to see individual conversion rates
* **Date range** — limit the analysis to a specific time period
***
## Reading a funnel report
A funnel report shows the number and percentage of opportunities at each stage of your pipeline, from initial entry to close. The key data points are:
| Data point | Description |
| ------------------------- | --------------------------------------------------------------------------- |
| **Stage name** | The pipeline stage label (e.g., New Lead, Qualified, Proposal Sent) |
| **Count** | Number of opportunities currently at or that have passed through this stage |
| **Conversion rate** | Percentage of opportunities that moved from this stage to the next |
| **Drop-off rate** | Percentage of opportunities lost at this stage |
| **Average time in stage** | How long opportunities typically remain before advancing or closing |
***
## Pipeline filters
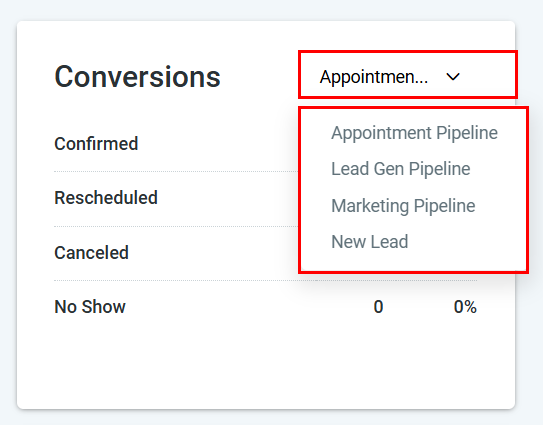
Use the filters in the Conversions section of Agent Reporting to focus your analysis:
* **Pipeline** — select a specific pipeline to analyze
* **Stages** — choose which stages to include in the funnel view
* **User** — filter by agent to see individual conversion rates
* **Date range** — limit the analysis to a specific time period
 ***
## Analyzing conversion rates
Look for stages with unusually high drop-off rates. A drop-off above 50% at a mid-funnel stage (such as Proposal Sent or Demo Scheduled) suggests a process, messaging, or qualification issue worth investigating.
Filter the Conversions section by individual agents on the same pipeline to compare stage-by-stage conversion rates. Agents who consistently advance more opportunities past a specific stage may have techniques worth sharing with the team.
Change the date range to compare conversion rates across different months or quarters. Improving conversion rates over time are a signal that process changes or coaching are taking effect.
Build a Custom Report with opportunities as the data source, add stage as a column, and apply date filters to create a fully exportable funnel view with the exact columns you need.
***
## Building a funnel report in custom reports
For a fully customized funnel view, use Custom Reports:
Go to **Reporting → Custom Reports** and click **Create Report**.
Choose **Opportunities** as your data object.
Include columns for pipeline name, stage name, opportunity value, status (open, won, lost), and assigned user.
Filter by pipeline, date range, and any other relevant criteria.
Add a bar or pie chart widget to visualize opportunity counts by stage. This gives you a visual funnel representation.
Save the report and share it with your sales team for regular review.
***
## Frequently asked questions
Funnel conversion data is surfaced within Agent Reporting (Conversions section) and the CRM Pipelines view rather than a standalone Funnel Report page. Custom Reports can be used to build a dedicated funnel report with your preferred columns and visualizations.
The Conversions section in Agent Reporting shows one pipeline at a time. To compare across pipelines, create a Custom Report with pipeline name as a column and group or filter as needed.
Use the Agent Reporting → Efficiency section to see average sales duration. For stage-level time data, build a Custom Report on opportunities that includes date fields for when each opportunity entered and exited a stage.
Yes. Export the Conversions view via the Agent Reporting export function, or build a Custom Report on opportunities and use the Export button to download as CSV or Excel.
***
## Related articles
* [Agent reporting](/reporting/agent-reporting)
* [Custom reports](/reporting/custom-reports)
* [Pipelines overview](/opportunities/pipelines)
***
## Analyzing conversion rates
Look for stages with unusually high drop-off rates. A drop-off above 50% at a mid-funnel stage (such as Proposal Sent or Demo Scheduled) suggests a process, messaging, or qualification issue worth investigating.
Filter the Conversions section by individual agents on the same pipeline to compare stage-by-stage conversion rates. Agents who consistently advance more opportunities past a specific stage may have techniques worth sharing with the team.
Change the date range to compare conversion rates across different months or quarters. Improving conversion rates over time are a signal that process changes or coaching are taking effect.
Build a Custom Report with opportunities as the data source, add stage as a column, and apply date filters to create a fully exportable funnel view with the exact columns you need.
***
## Building a funnel report in custom reports
For a fully customized funnel view, use Custom Reports:
Go to **Reporting → Custom Reports** and click **Create Report**.
Choose **Opportunities** as your data object.
Include columns for pipeline name, stage name, opportunity value, status (open, won, lost), and assigned user.
Filter by pipeline, date range, and any other relevant criteria.
Add a bar or pie chart widget to visualize opportunity counts by stage. This gives you a visual funnel representation.
Save the report and share it with your sales team for regular review.
***
## Frequently asked questions
Funnel conversion data is surfaced within Agent Reporting (Conversions section) and the CRM Pipelines view rather than a standalone Funnel Report page. Custom Reports can be used to build a dedicated funnel report with your preferred columns and visualizations.
The Conversions section in Agent Reporting shows one pipeline at a time. To compare across pipelines, create a Custom Report with pipeline name as a column and group or filter as needed.
Use the Agent Reporting → Efficiency section to see average sales duration. For stage-level time data, build a Custom Report on opportunities that includes date fields for when each opportunity entered and exited a stage.
Yes. Export the Conversions view via the Agent Reporting export function, or build a Custom Report on opportunities and use the Export button to download as CSV or Excel.
***
## Related articles
* [Agent reporting](/reporting/agent-reporting)
* [Custom reports](/reporting/custom-reports)
* [Pipelines overview](/opportunities/pipelines)