> ## Documentation Index
> Fetch the complete documentation index at: https://help.hoopai.com/llms.txt
> Use this file to discover all available pages before exploring further.
# Custom Reports
> Build tailored reports in the HoopAI Platform using your own metrics, filters, widgets, and column configurations.
Custom Reports allow you to provide concise and dynamic information about your company's health. When handling your data inside the platform, you want an easy way to relay this information to your intended audience — Custom Reports lets you build exactly what you need.
## Accessing custom reports
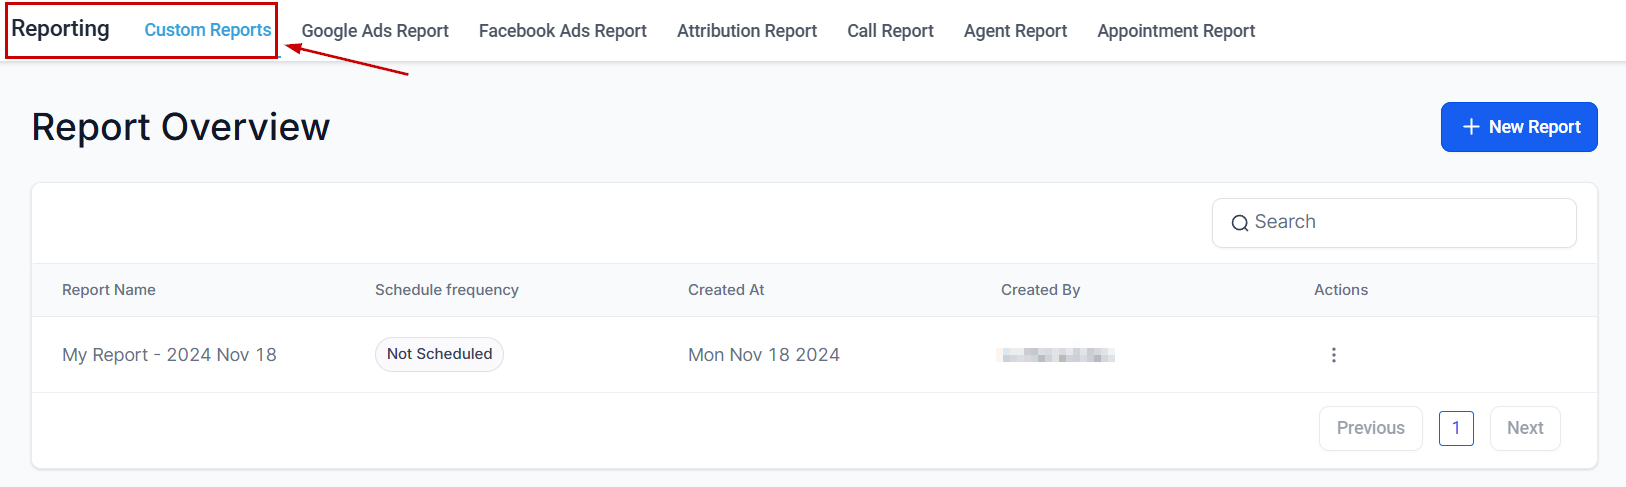
Navigate to **Reporting** in the left sidebar, then select **Custom Reports**.
 ***
## Creating a custom report
Go to **Reporting → Custom Reports** and click the **Create Report** button.
***
## Creating a custom report
Go to **Reporting → Custom Reports** and click the **Create Report** button.
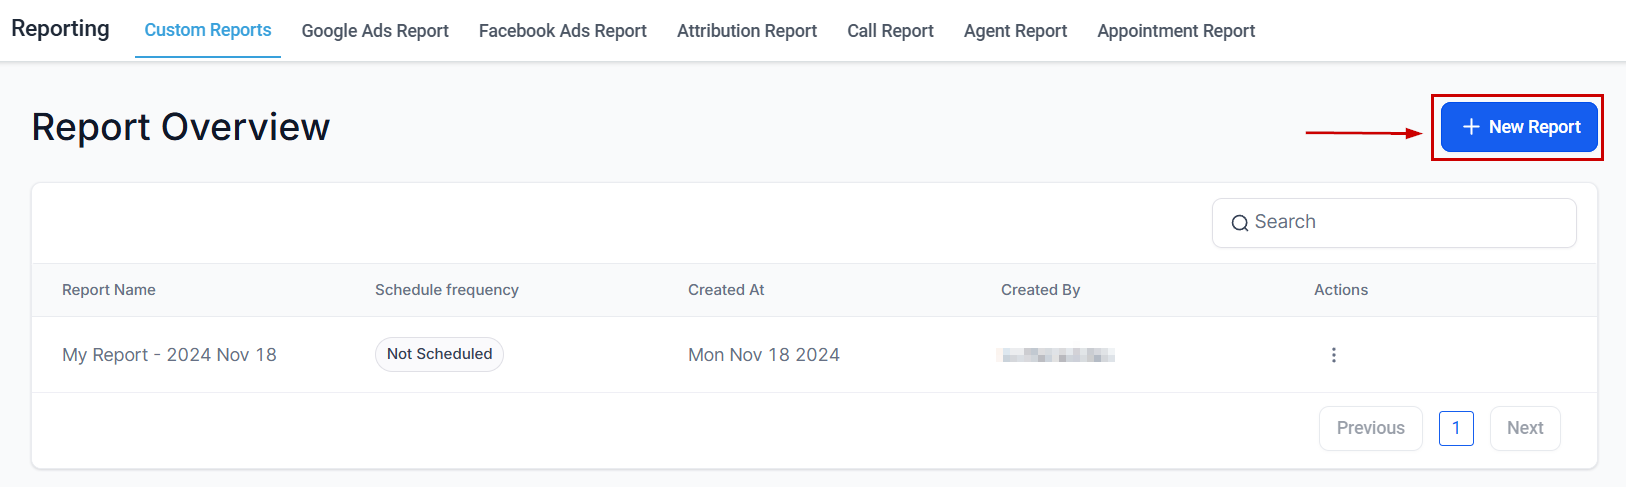 Give your report a descriptive name so it's easy to find and share with your team.
Select the type of data to analyze — contacts, opportunities, appointments, conversations, or other objects in your account.
Give your report a descriptive name so it's easy to find and share with your team.
Select the type of data to analyze — contacts, opportunities, appointments, conversations, or other objects in your account.
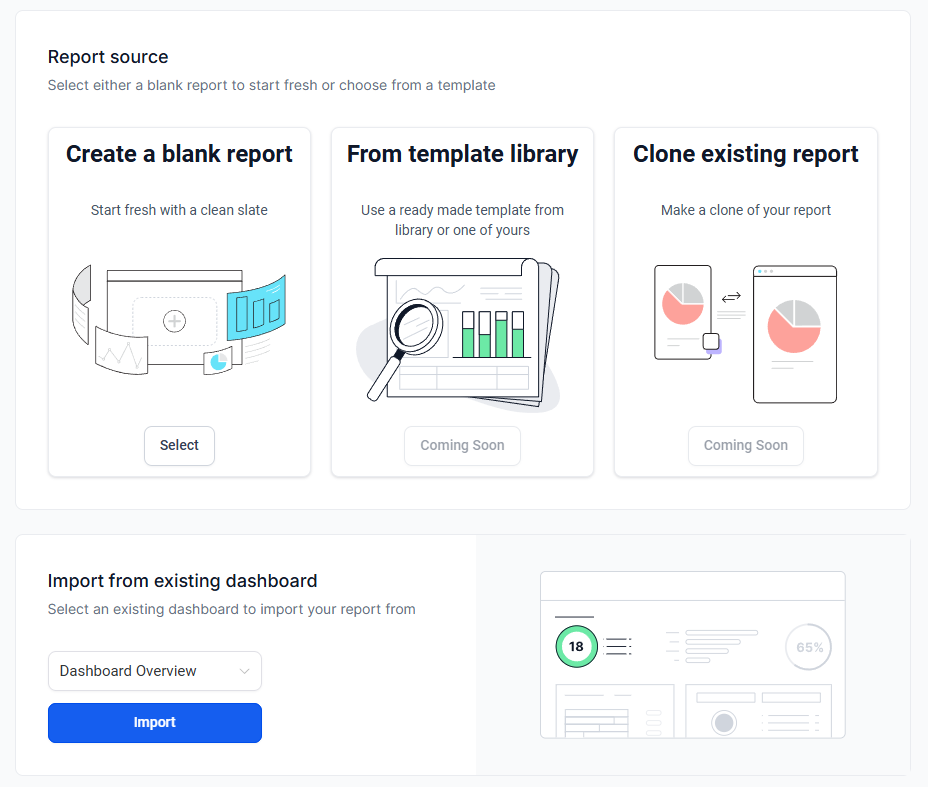 Pick the fields you want to include as columns in your report. You can add standard fields (name, email, status) as well as custom fields you have created in your account.
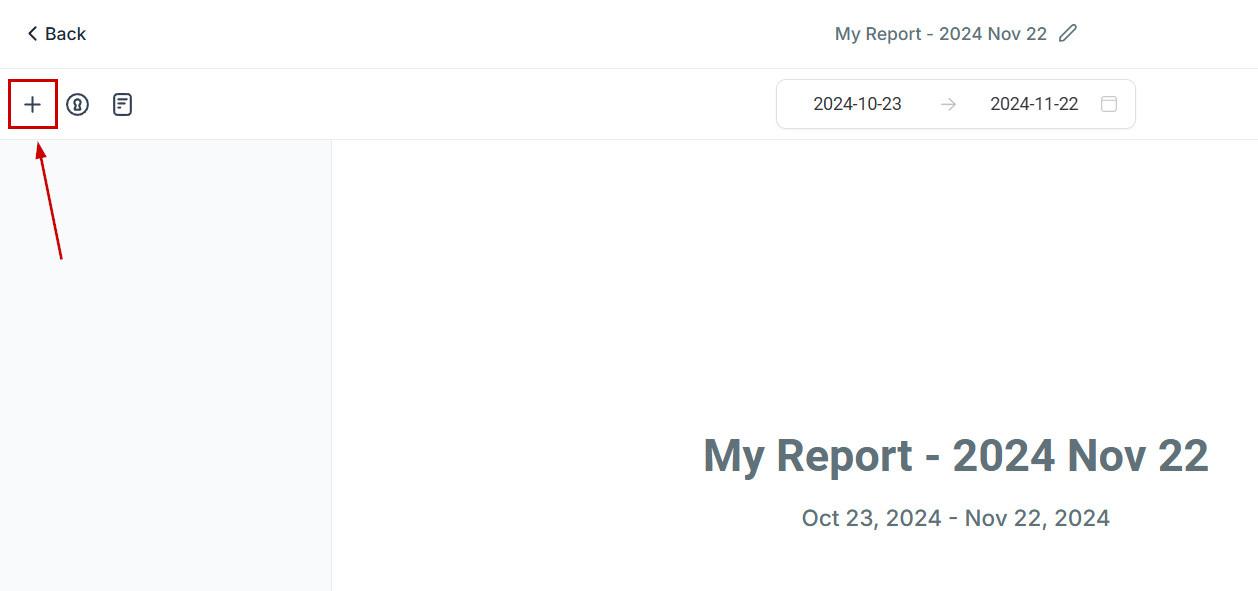 Narrow your dataset by setting filter conditions — for example, contacts tagged as "hot lead" created in the last 30 days.
Add chart widgets to visualize your data. Widgets can display bar charts, line graphs, pie charts, and summary metrics. You can also move and reorder widgets within the report.
Narrow your dataset by setting filter conditions — for example, contacts tagged as "hot lead" created in the last 30 days.
Add chart widgets to visualize your data. Widgets can display bar charts, line graphs, pie charts, and summary metrics. You can also move and reorder widgets within the report.
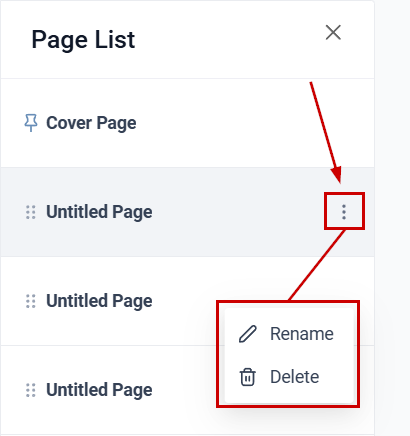 Save the report. It will appear in your Custom Reports list for quick access. Reports can be shared with other team members in your account.
***
## Widget-level customization
You can customize individual widgets within your report:
* **Widget type** — choose chart type (bar, line, pie, table, etc.)
* **Metrics** — select which data fields the widget displays
* **Colors** — apply custom colors to distinguish between data series
* **Filters** — apply widget-level filters that override the report-level filter for that widget only
Widget-level filters let you show different subsets of data side-by-side in the same report — for example, a chart for leads from Facebook next to one for leads from Google.
***
## Sharing and exporting
* **Export** — download the report as a CSV or Excel file for offline analysis or sharing with stakeholders outside the platform.
* **Share** — share saved reports with other users in your account so the whole team works from the same data.
* **Schedule** — configure scheduled report delivery to receive reports via email at set intervals.
***
## Use cases
Build a report filtering contacts by source to compare how many leads each channel (Facebook, Google, organic) has generated in a given period.
Report on opportunities by stage, value, and assigned owner to get a snapshot of where deals stand and which stages have the most drop-off.
Filter conversations or contacts by a specific tag, campaign, or workflow to measure engagement and response rates.
Surface data stored in custom fields — such as industry, referral source, or service type — in a clean table view for segmentation analysis.
Create multi-page reports where each page focuses on a different aspect of your business (e.g., Page 1: Lead Generation, Page 2: Sales Performance, Page 3: Call Activity).
Save commonly used filter and column combinations as named reports so your team can access them with one click, without reconfiguring filters each time.
***
## Custom metrics for dashboard reports
Custom metrics let you create calculated KPIs that combine data from multiple sources. Metrics created in Custom Reports are also available as dashboard widgets, and vice versa.
To create a custom metric:
1. In your Custom Report, click **Add Widget** and switch to the **Custom Metrics** tab
2. Click **+ Create Custom Metric**
3. Enter a name, data type (currency, percentage, number), and description
4. Build the formula using the formula builder — combine up to 4 metrics with operators (+, -, x, /)
5. Click **Create**
The custom metric appears in both your report and the dashboard Custom Metrics library.
***
## Custom report template library
Save commonly used report configurations as templates for quick reuse:
1. Create and configure a Custom Report with your desired data source, columns, filters, and widgets
2. Click the **three-dot menu** and select **Save as Template**
3. Enter a template name and save
Templates are accessible from the **Create Report** dialog. Select **From Template** to start a new report with pre-configured columns, filters, and widget layout.
Create templates for recurring reporting needs — monthly sales review, weekly lead source analysis, quarterly pipeline health — so your team generates consistent reports without reconfiguring each time.
***
## Frequently asked questions
Custom reports are visible to all users in your account with reporting access. You can share saved reports with team members, and administrators can control which reports appear for which roles.
Yes. When selecting columns, both standard fields and any custom fields you have created are available. This allows you to report on data specific to your business.
Open the report, click **Schedule**, and configure the delivery frequency (daily, weekly, or monthly) along with the recipient email addresses. The report will be delivered automatically at the configured interval.
Widgets support bar charts, line graphs, pie charts, and summary metric tiles. You can add multiple widgets per report page and rearrange them by dragging.
Yes. Custom reports support multiple pages, each with its own widgets, filters, and metrics. Use this to organize a report into sections — for example, one page for lead generation and another for sales performance.
Report-level filters apply to all widgets on all pages. Widget-level filters override the report filter for that specific widget only, letting you display different data subsets side-by-side in the same report.
***
## Related articles
* [Audit reports](/reporting/audit-reports)
* [Custom fields](/settings/custom-fields)
* [Custom values](/settings/custom-values)
* [Agent reporting](/reporting/agent-reporting)
Save the report. It will appear in your Custom Reports list for quick access. Reports can be shared with other team members in your account.
***
## Widget-level customization
You can customize individual widgets within your report:
* **Widget type** — choose chart type (bar, line, pie, table, etc.)
* **Metrics** — select which data fields the widget displays
* **Colors** — apply custom colors to distinguish between data series
* **Filters** — apply widget-level filters that override the report-level filter for that widget only
Widget-level filters let you show different subsets of data side-by-side in the same report — for example, a chart for leads from Facebook next to one for leads from Google.
***
## Sharing and exporting
* **Export** — download the report as a CSV or Excel file for offline analysis or sharing with stakeholders outside the platform.
* **Share** — share saved reports with other users in your account so the whole team works from the same data.
* **Schedule** — configure scheduled report delivery to receive reports via email at set intervals.
***
## Use cases
Build a report filtering contacts by source to compare how many leads each channel (Facebook, Google, organic) has generated in a given period.
Report on opportunities by stage, value, and assigned owner to get a snapshot of where deals stand and which stages have the most drop-off.
Filter conversations or contacts by a specific tag, campaign, or workflow to measure engagement and response rates.
Surface data stored in custom fields — such as industry, referral source, or service type — in a clean table view for segmentation analysis.
Create multi-page reports where each page focuses on a different aspect of your business (e.g., Page 1: Lead Generation, Page 2: Sales Performance, Page 3: Call Activity).
Save commonly used filter and column combinations as named reports so your team can access them with one click, without reconfiguring filters each time.
***
## Custom metrics for dashboard reports
Custom metrics let you create calculated KPIs that combine data from multiple sources. Metrics created in Custom Reports are also available as dashboard widgets, and vice versa.
To create a custom metric:
1. In your Custom Report, click **Add Widget** and switch to the **Custom Metrics** tab
2. Click **+ Create Custom Metric**
3. Enter a name, data type (currency, percentage, number), and description
4. Build the formula using the formula builder — combine up to 4 metrics with operators (+, -, x, /)
5. Click **Create**
The custom metric appears in both your report and the dashboard Custom Metrics library.
***
## Custom report template library
Save commonly used report configurations as templates for quick reuse:
1. Create and configure a Custom Report with your desired data source, columns, filters, and widgets
2. Click the **three-dot menu** and select **Save as Template**
3. Enter a template name and save
Templates are accessible from the **Create Report** dialog. Select **From Template** to start a new report with pre-configured columns, filters, and widget layout.
Create templates for recurring reporting needs — monthly sales review, weekly lead source analysis, quarterly pipeline health — so your team generates consistent reports without reconfiguring each time.
***
## Frequently asked questions
Custom reports are visible to all users in your account with reporting access. You can share saved reports with team members, and administrators can control which reports appear for which roles.
Yes. When selecting columns, both standard fields and any custom fields you have created are available. This allows you to report on data specific to your business.
Open the report, click **Schedule**, and configure the delivery frequency (daily, weekly, or monthly) along with the recipient email addresses. The report will be delivered automatically at the configured interval.
Widgets support bar charts, line graphs, pie charts, and summary metric tiles. You can add multiple widgets per report page and rearrange them by dragging.
Yes. Custom reports support multiple pages, each with its own widgets, filters, and metrics. Use this to organize a report into sections — for example, one page for lead generation and another for sales performance.
Report-level filters apply to all widgets on all pages. Widget-level filters override the report filter for that specific widget only, letting you display different data subsets side-by-side in the same report.
***
## Related articles
* [Audit reports](/reporting/audit-reports)
* [Custom fields](/settings/custom-fields)
* [Custom values](/settings/custom-values)
* [Agent reporting](/reporting/agent-reporting)