> ## Documentation Index
> Fetch the complete documentation index at: https://help.hoopai.com/llms.txt
> Use this file to discover all available pages before exploring further.
# Contact Growth Report
> Track new contacts added over time, see how your database is growing, and understand which sources are driving the most contact acquisition in the HoopAI Platform.
The contact growth report shows you how your contact database is expanding over time and where those new contacts are coming from. Whether you are running paid ads, publishing organic content, or relying on referrals, this report helps you understand which acquisition channels are working and at what volume.
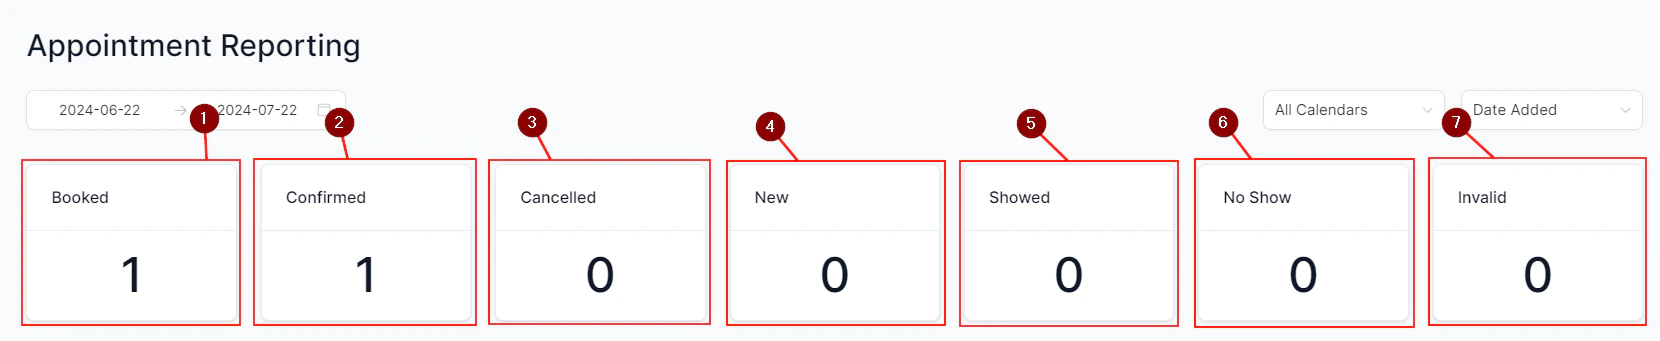 ## Accessing contact growth data
Contact growth data is available through custom dashboard widgets built on the **Contacts** data source. Because contact acquisition patterns vary significantly by business, HoopAI gives you the flexibility to build the exact growth view you need rather than locking you into a single preset report.
To get started:
1. Open your dashboard and click **Edit**.
2. Add a new widget and choose the **Contacts** category.
3. Select a chart type — a **Line** chart works well for tracking growth trends over time; a **Bar** chart works well for comparing sources side by side.
4. Apply a **Date Created** filter to scope the data to new contacts only.
5. Group or filter by **Source** or **Attribution** fields to break down growth by channel.
***
## Contact source types
Every contact in HoopAI is assigned a source label that describes how they entered the CRM:
| Source | Description |
| --------------------- | --------------------------------------------------------------------------------------- |
| **Form submission** | Contact submitted a native HoopAI form or survey |
| **Calendar booking** | Contact booked an appointment through a HoopAI calendar |
| **Manual (CRM UI)** | Contact was created manually inside the platform by a team member |
| **Import** | Contact was added through a CSV bulk import |
| **Integration / API** | Contact was created by a connected third-party tool such as Zapier or a direct API call |
| **Order form** | Contact submitted an order form (with or without a purchase) |
| **Chat widget** | Contact captured through a chat widget or web chat interaction |
| **Facebook Lead Ad** | Contact synced directly from a Facebook Lead Ads campaign |
Attribution source (paid search, organic search, paid social, etc.) and contact source (how they entered the CRM) are two different fields. Attribution reflects the traffic channel; contact source reflects the HoopAI tool or method used to create the record.
***
## Tracking new contacts over time
To visualize contact acquisition trends:
1. Build a Line widget on your dashboard using the **Contacts** data source.
2. Set the x-axis to **Date Created** and group by **Day**, **Week**, or **Month** depending on the time period you are analyzing.
3. Save the widget and adjust your dashboard date range filter to see the growth curve.
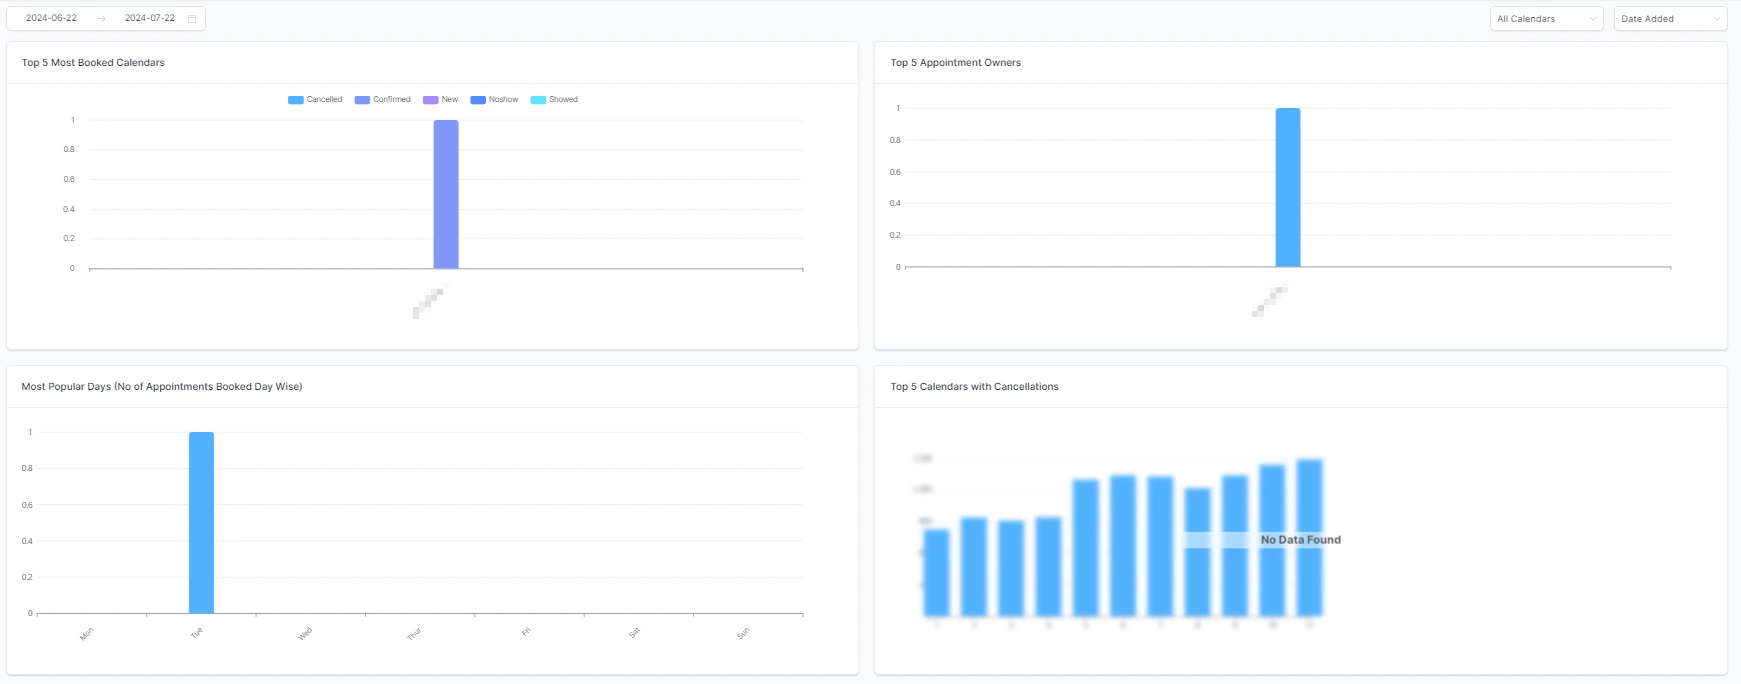
This view is useful for spotting patterns — for example, a spike in new contacts following a campaign launch, or a drop-off that coincides with a seasonal slowdown or an expired ad.
## Accessing contact growth data
Contact growth data is available through custom dashboard widgets built on the **Contacts** data source. Because contact acquisition patterns vary significantly by business, HoopAI gives you the flexibility to build the exact growth view you need rather than locking you into a single preset report.
To get started:
1. Open your dashboard and click **Edit**.
2. Add a new widget and choose the **Contacts** category.
3. Select a chart type — a **Line** chart works well for tracking growth trends over time; a **Bar** chart works well for comparing sources side by side.
4. Apply a **Date Created** filter to scope the data to new contacts only.
5. Group or filter by **Source** or **Attribution** fields to break down growth by channel.
***
## Contact source types
Every contact in HoopAI is assigned a source label that describes how they entered the CRM:
| Source | Description |
| --------------------- | --------------------------------------------------------------------------------------- |
| **Form submission** | Contact submitted a native HoopAI form or survey |
| **Calendar booking** | Contact booked an appointment through a HoopAI calendar |
| **Manual (CRM UI)** | Contact was created manually inside the platform by a team member |
| **Import** | Contact was added through a CSV bulk import |
| **Integration / API** | Contact was created by a connected third-party tool such as Zapier or a direct API call |
| **Order form** | Contact submitted an order form (with or without a purchase) |
| **Chat widget** | Contact captured through a chat widget or web chat interaction |
| **Facebook Lead Ad** | Contact synced directly from a Facebook Lead Ads campaign |
Attribution source (paid search, organic search, paid social, etc.) and contact source (how they entered the CRM) are two different fields. Attribution reflects the traffic channel; contact source reflects the HoopAI tool or method used to create the record.
***
## Tracking new contacts over time
To visualize contact acquisition trends:
1. Build a Line widget on your dashboard using the **Contacts** data source.
2. Set the x-axis to **Date Created** and group by **Day**, **Week**, or **Month** depending on the time period you are analyzing.
3. Save the widget and adjust your dashboard date range filter to see the growth curve.
This view is useful for spotting patterns — for example, a spike in new contacts following a campaign launch, or a drop-off that coincides with a seasonal slowdown or an expired ad.
 ***
## Source breakdown
Breaking down contact growth by source reveals which acquisition channels are generating the most volume:
1. Add a **Donut** or **Bar** widget using the **Contacts** data source.
2. Group the data by **Attribution Source** or **Contact Source**.
3. Apply a date range to limit the view to a specific campaign period.
***
## Source breakdown
Breaking down contact growth by source reveals which acquisition channels are generating the most volume:
1. Add a **Donut** or **Bar** widget using the **Contacts** data source.
2. Group the data by **Attribution Source** or **Contact Source**.
3. Apply a date range to limit the view to a specific campaign period.
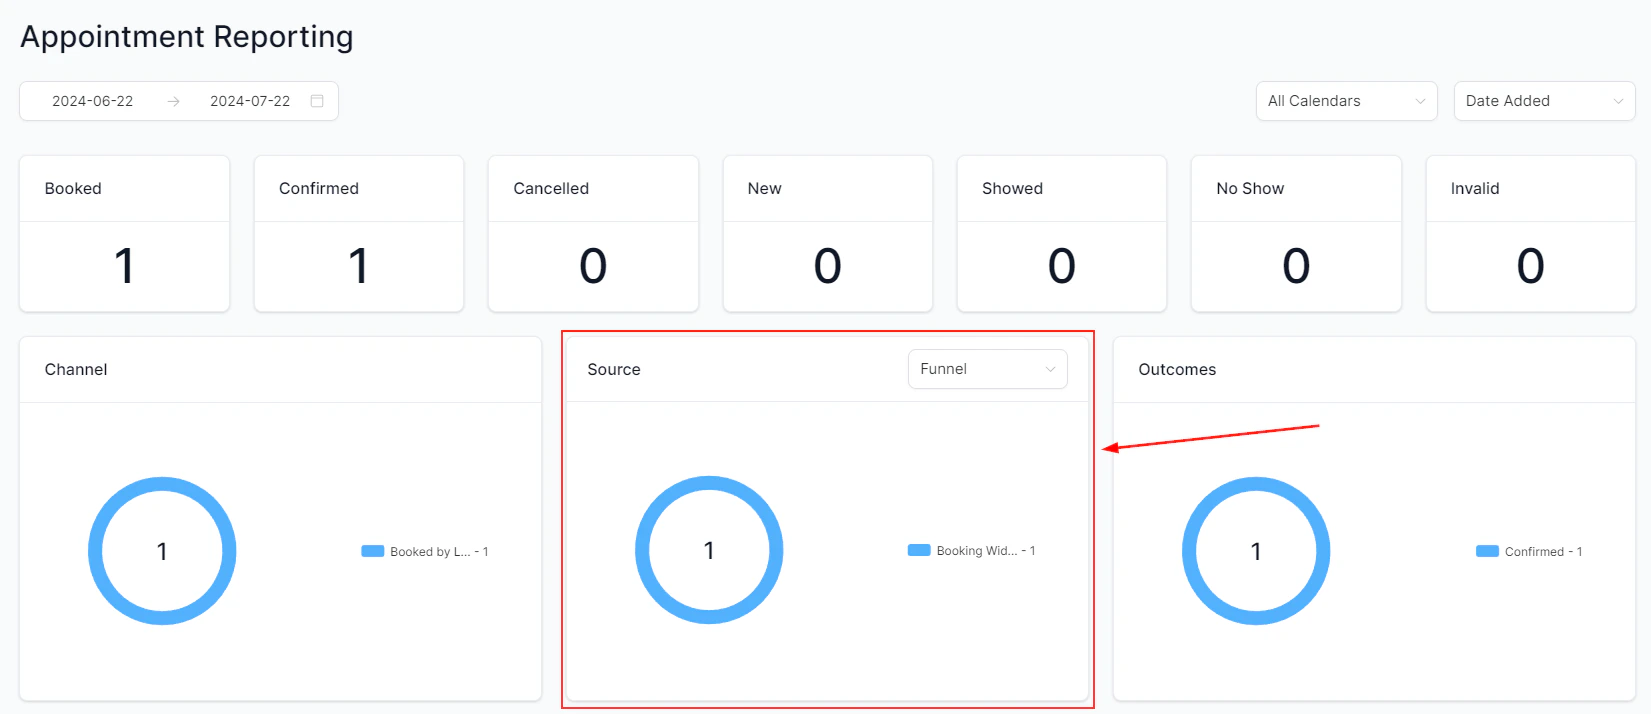 This breakdown commonly surfaces insights such as:
* Paid search driving high volume but low quality (contacts who never convert)
* Organic search producing fewer contacts but with higher booking rates
* Referral traffic representing a small share of volume but an outsized share of closed deals
***
## Attribution-based growth analysis
For a more detailed picture, combine contact growth with attribution data:
1. Add a Table widget with the **Contacts** data source.
2. Include columns for **Date Created**, **First Attribution Source**, **First Attribution Campaign**, and **UTM Medium**.
3. Apply filters to scope to specific date ranges, campaigns, or traffic types.
4. Export as CSV to analyze in a spreadsheet tool.
This gives you a row-level record of every new contact, the channel that brought them in, and the specific campaign or ad that was responsible.
Run this export monthly and compare it against your marketing spend by channel to calculate a rough cost per contact for each source. Over time, this helps you shift budget toward your most efficient acquisition channels.
***
## Monitoring list health
Contact growth is only meaningful if the new contacts are engaged and valid. Alongside raw growth metrics, track:
* **Unsubscribe and opt-out rates** — a growing list with rising unsubscribes signals that the contact quality may be declining.
* **Duplicate contacts** — use the contact deduplication tools under **Contacts → Tools** to keep your database clean as it scales.
* **Bounce rates in email campaigns** — a high bounce rate on emails to recently imported contacts suggests the list source may not be high quality.
***
## Frequently asked questions
Yes, if you filter by the **Assigned User** field on the Contacts widget, you can see which team members are adding the most new contacts — useful for tracking prospecting activity by salesperson.
No. Deleted contacts are removed from all reports. If contact records are routinely deleted and re-added, your growth numbers may undercount total acquisition volume.
Embed a native HoopAI form on the landing page and name it clearly. You can then filter your contact growth report by the form source field to see all contacts captured from that specific page.
Custom dashboard widgets support threshold indicators. Set a goal for the month and compare it against the actual new contact count using a metric widget. For more advanced goal tracking, use the custom reports feature with date-based filtering.
***
## Related articles
* [Attribution reporting](/reporting/attribution-reporting)
* [Custom reports](/reporting/custom-reports)
* [Conversion reporting](/reporting/conversion-reporting)
* [Ads reporting](/reporting/ads-reporting)
This breakdown commonly surfaces insights such as:
* Paid search driving high volume but low quality (contacts who never convert)
* Organic search producing fewer contacts but with higher booking rates
* Referral traffic representing a small share of volume but an outsized share of closed deals
***
## Attribution-based growth analysis
For a more detailed picture, combine contact growth with attribution data:
1. Add a Table widget with the **Contacts** data source.
2. Include columns for **Date Created**, **First Attribution Source**, **First Attribution Campaign**, and **UTM Medium**.
3. Apply filters to scope to specific date ranges, campaigns, or traffic types.
4. Export as CSV to analyze in a spreadsheet tool.
This gives you a row-level record of every new contact, the channel that brought them in, and the specific campaign or ad that was responsible.
Run this export monthly and compare it against your marketing spend by channel to calculate a rough cost per contact for each source. Over time, this helps you shift budget toward your most efficient acquisition channels.
***
## Monitoring list health
Contact growth is only meaningful if the new contacts are engaged and valid. Alongside raw growth metrics, track:
* **Unsubscribe and opt-out rates** — a growing list with rising unsubscribes signals that the contact quality may be declining.
* **Duplicate contacts** — use the contact deduplication tools under **Contacts → Tools** to keep your database clean as it scales.
* **Bounce rates in email campaigns** — a high bounce rate on emails to recently imported contacts suggests the list source may not be high quality.
***
## Frequently asked questions
Yes, if you filter by the **Assigned User** field on the Contacts widget, you can see which team members are adding the most new contacts — useful for tracking prospecting activity by salesperson.
No. Deleted contacts are removed from all reports. If contact records are routinely deleted and re-added, your growth numbers may undercount total acquisition volume.
Embed a native HoopAI form on the landing page and name it clearly. You can then filter your contact growth report by the form source field to see all contacts captured from that specific page.
Custom dashboard widgets support threshold indicators. Set a goal for the month and compare it against the actual new contact count using a metric widget. For more advanced goal tracking, use the custom reports feature with date-based filtering.
***
## Related articles
* [Attribution reporting](/reporting/attribution-reporting)
* [Custom reports](/reporting/custom-reports)
* [Conversion reporting](/reporting/conversion-reporting)
* [Ads reporting](/reporting/ads-reporting)