> ## Documentation Index
> Fetch the complete documentation index at: https://help.hoopai.com/llms.txt
> Use this file to discover all available pages before exploring further.
# Agent Reporting
> Measure individual agent and team member performance across calls, conversations, SMS, email, and opportunities in the HoopAI Platform.
The Agent Report provides a centralized platform to monitor and evaluate the actions performed by users within your organization. This section offers a detailed view of key performance indicators including opportunities, conversions, SMS and email campaigns, leaderboard rankings, call metrics, and efficiency analysis.
## Accessing agent reporting
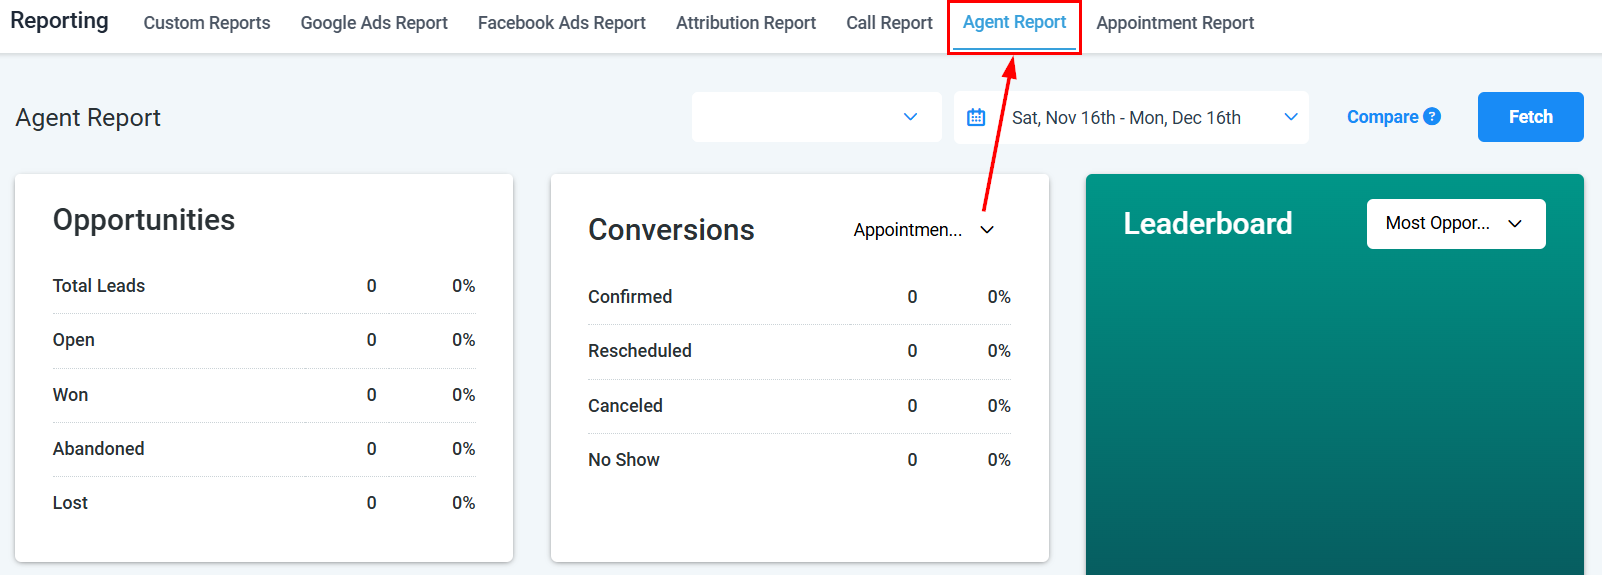
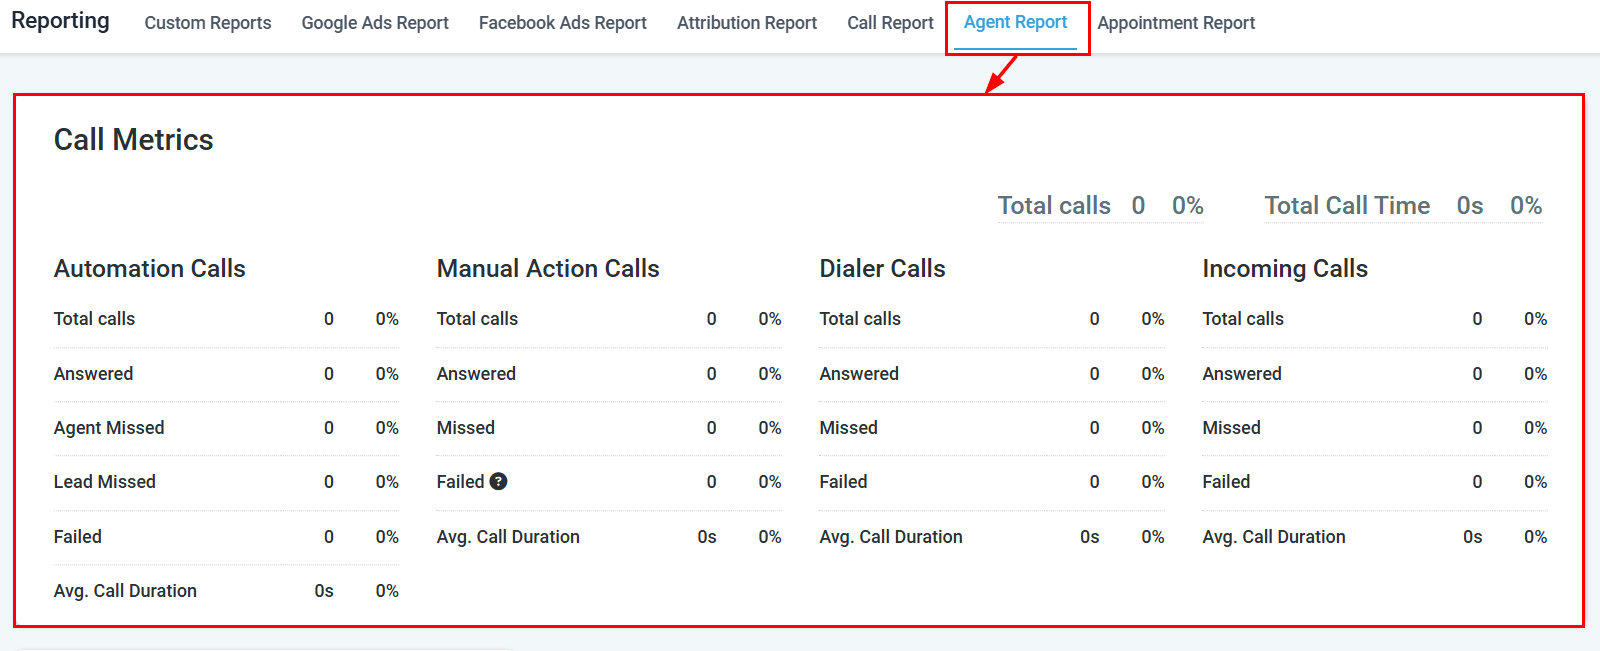
Navigate to **Reporting** in the left sidebar, then select the **Agent Reporting** tab.
 ***
## Filters and controls
### User filter
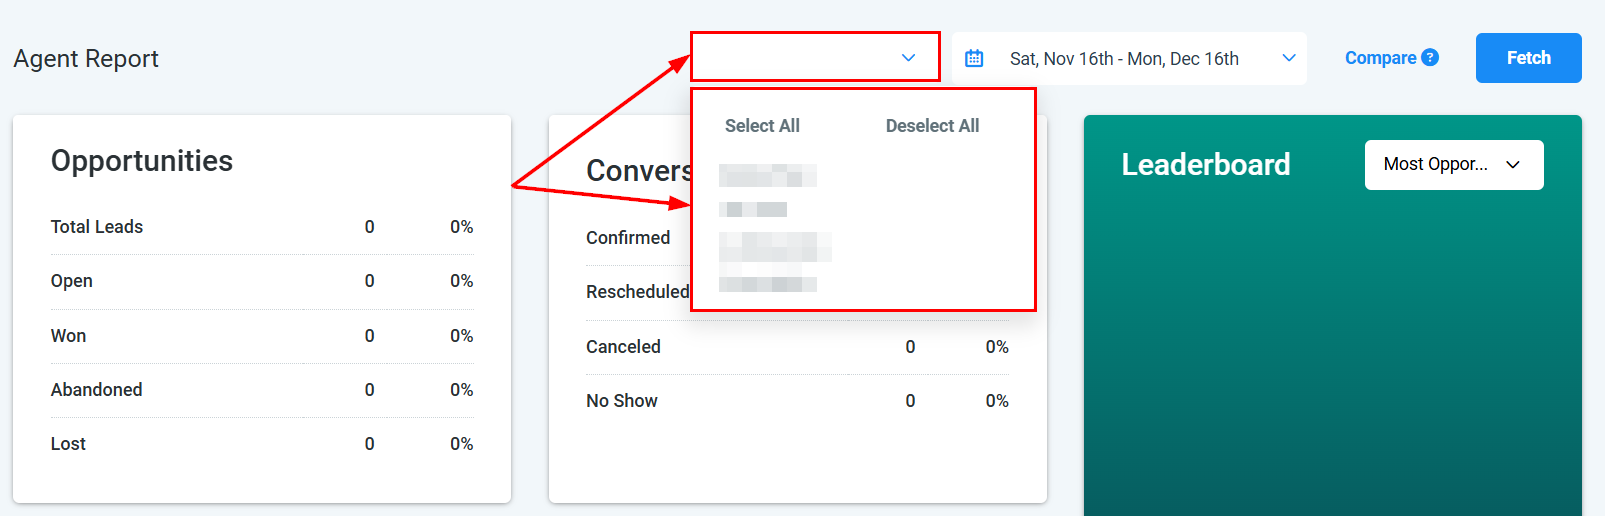
Use the **User** dropdown to select a specific team member or view data for all users simultaneously.
***
## Filters and controls
### User filter
Use the **User** dropdown to select a specific team member or view data for all users simultaneously.
 ### Date range
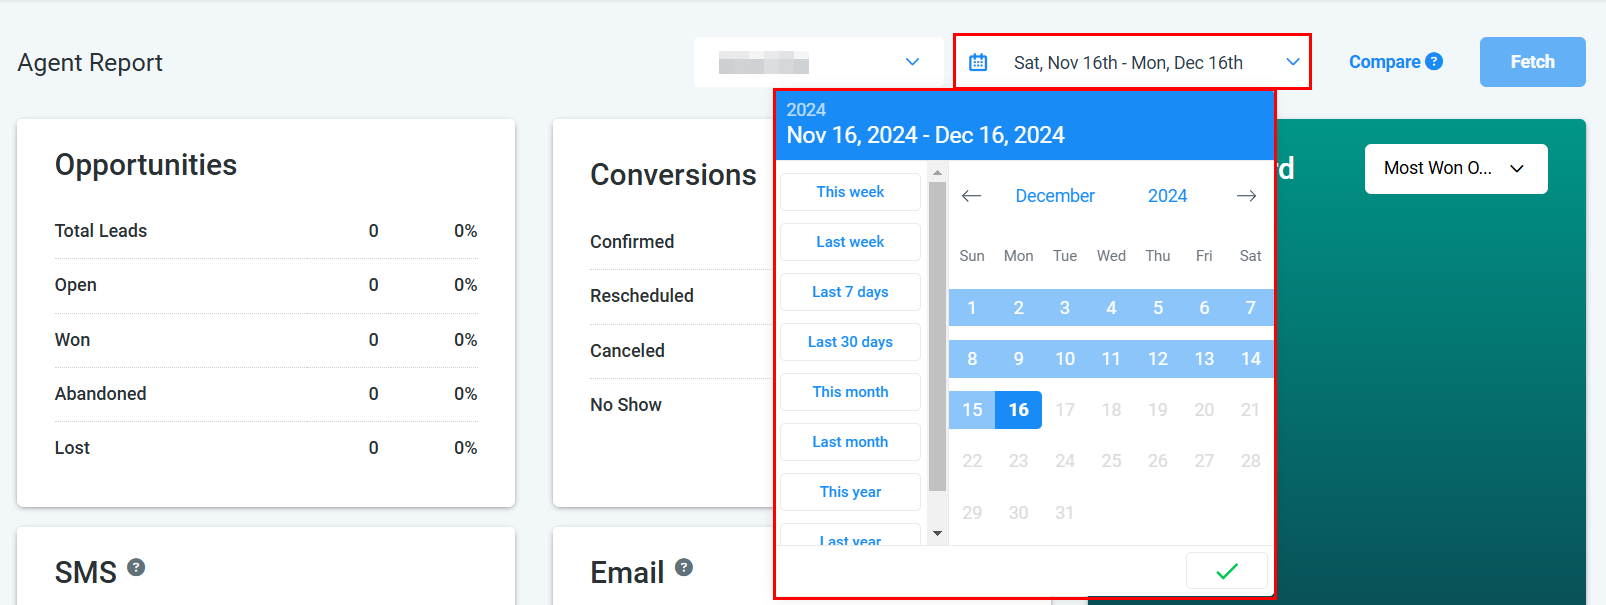
Set a date range to focus on a specific time period.
### Date range
Set a date range to focus on a specific time period.
 ***
## Report sections
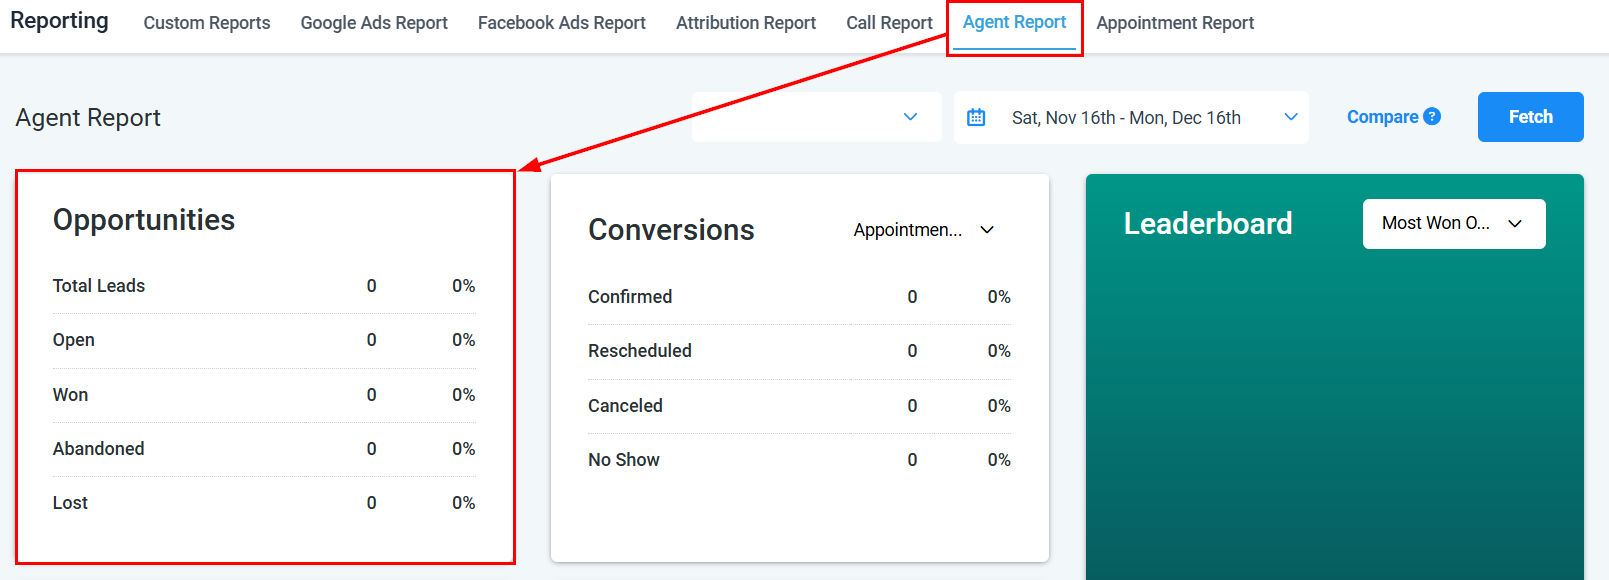
The Opportunities section shows pipeline performance for the selected user, including total leads, open opportunities, won deals, lost deals, and abandoned opportunities.
***
## Report sections
The Opportunities section shows pipeline performance for the selected user, including total leads, open opportunities, won deals, lost deals, and abandoned opportunities.
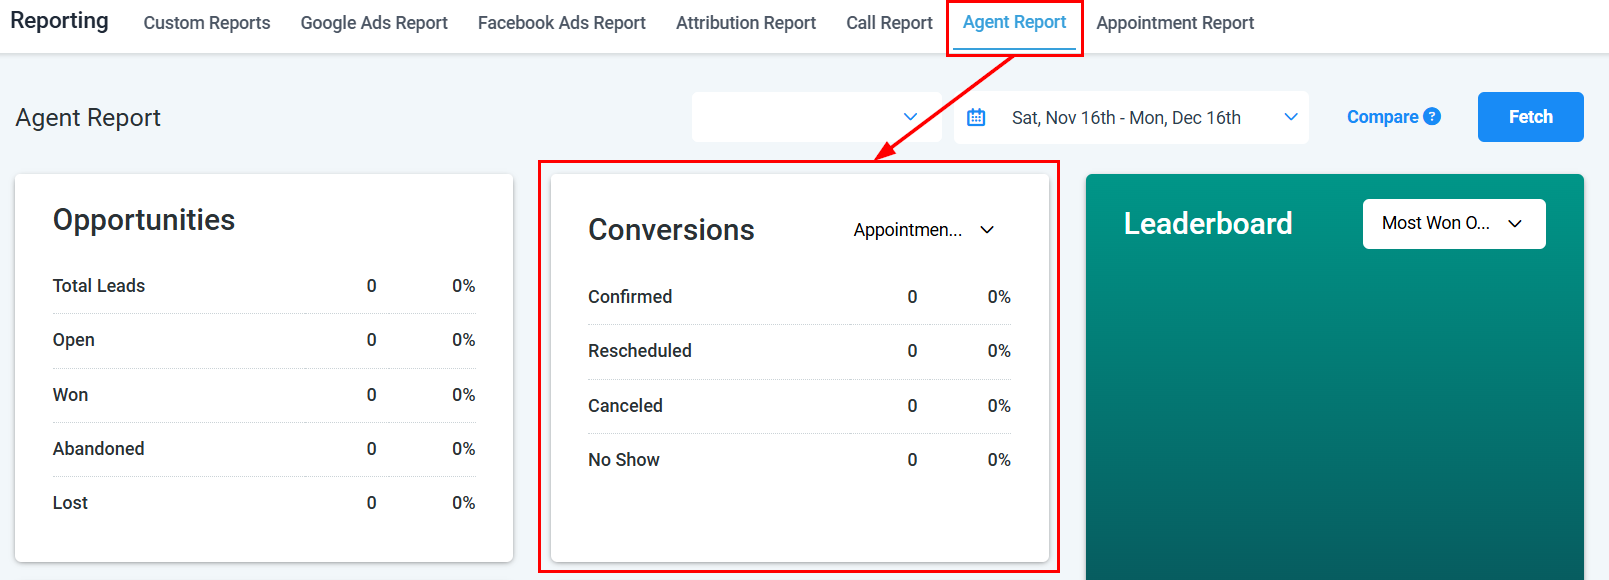
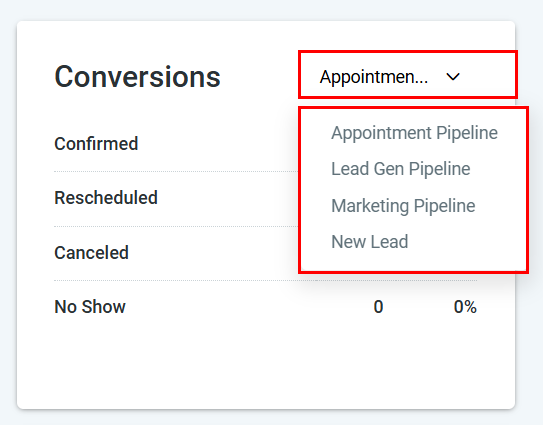
 The Conversions segment offers a detailed view of your pipelines, providing insights into potential opportunities and their stages of progress. Navigate to the **Reporting** section, click the **Agent Reporting** tab, then scroll to the **Conversions** section.
Filters available:
* **Pipeline** — select which pipeline to analyze
* **Stages** — view conversion rates by pipeline stage
The Conversions segment offers a detailed view of your pipelines, providing insights into potential opportunities and their stages of progress. Navigate to the **Reporting** section, click the **Agent Reporting** tab, then scroll to the **Conversions** section.
Filters available:
* **Pipeline** — select which pipeline to analyze
* **Stages** — view conversion rates by pipeline stage
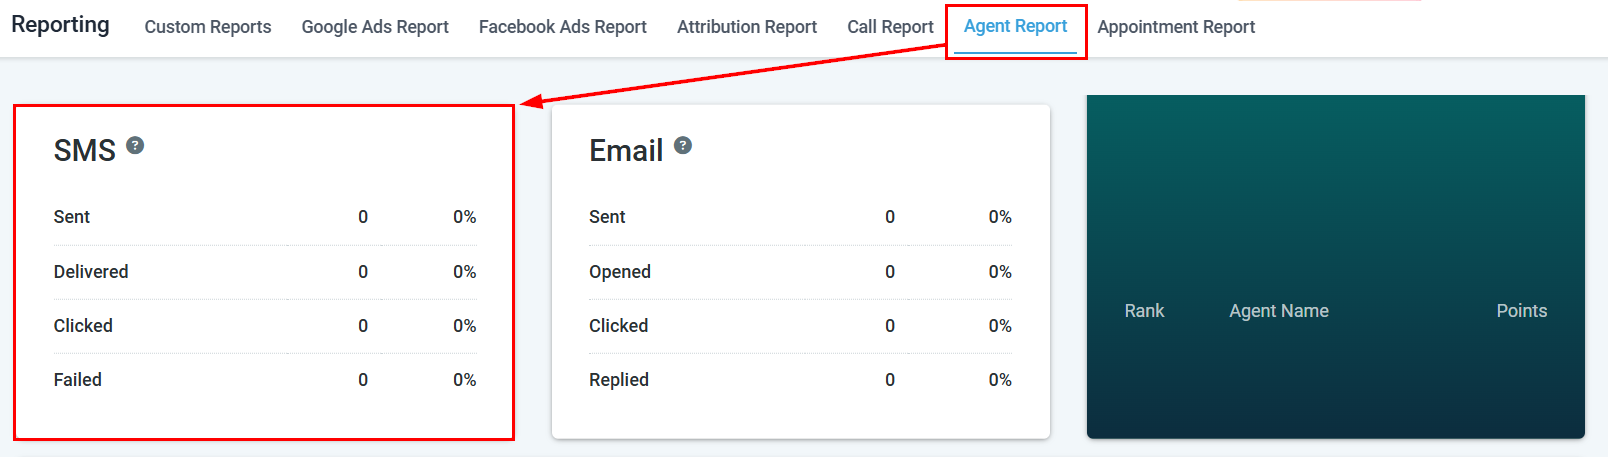
 The SMS section provides a comprehensive analysis of text message activities performed by an agent, including:
* **Sent** — total SMS messages sent
* **Delivered** — delivery success rate
* **Clicked** — link click rate
* **Failed** — messages that failed to deliver
The SMS section provides a comprehensive analysis of text message activities performed by an agent, including:
* **Sent** — total SMS messages sent
* **Delivered** — delivery success rate
* **Clicked** — link click rate
* **Failed** — messages that failed to deliver
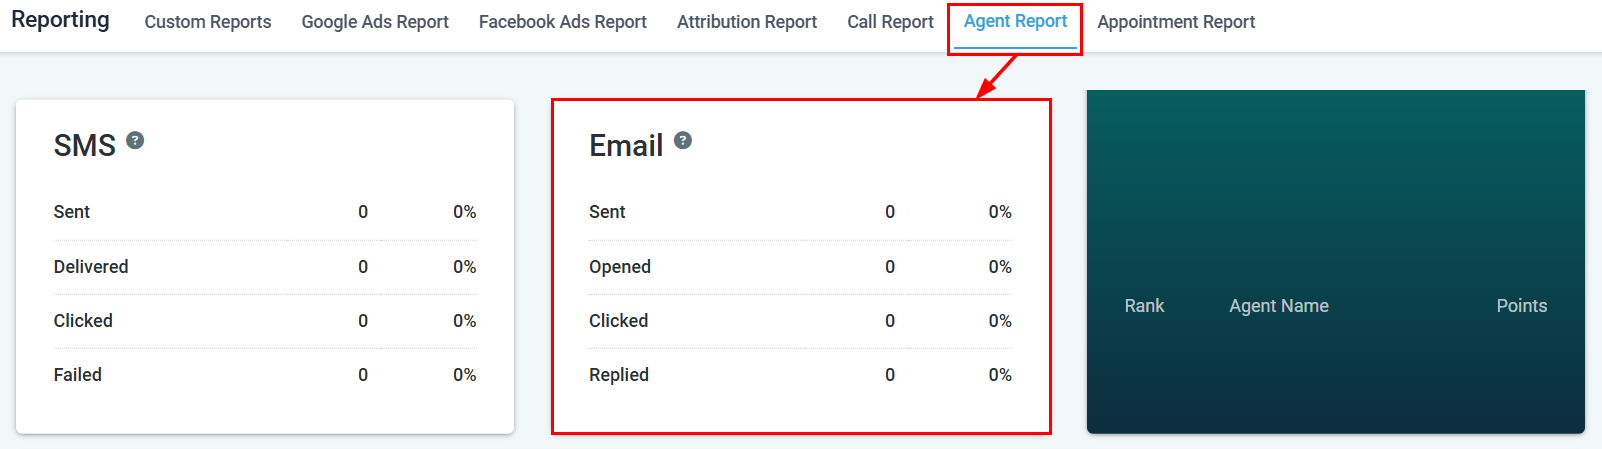
 The Email section provides a detailed analysis of email campaign performance for individual agents, including:
* **Sent** — total emails sent
* **Opened** — open rate percentage
* **Clicked** — link click rate
* **Replied** — reply rate
The Email section provides a detailed analysis of email campaign performance for individual agents, including:
* **Sent** — total emails sent
* **Opened** — open rate percentage
* **Clicked** — link click rate
* **Replied** — reply rate
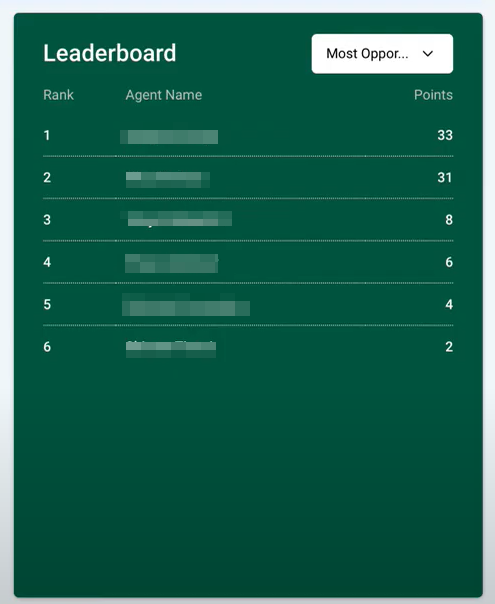
 The Leaderboard offers a detailed view of your team's performance in managing opportunities and securing deals. It ranks agents by name and total accumulated points.
The leaderboard includes:
* **Rank** — agent position
* **Name** — agent name
* **Points** — total performance points
Navigate to **Reporting > Agent Reporting**, then scroll to the **Leaderboard** section.
The Leaderboard offers a detailed view of your team's performance in managing opportunities and securing deals. It ranks agents by name and total accumulated points.
The leaderboard includes:
* **Rank** — agent position
* **Name** — agent name
* **Points** — total performance points
Navigate to **Reporting > Agent Reporting**, then scroll to the **Leaderboard** section.
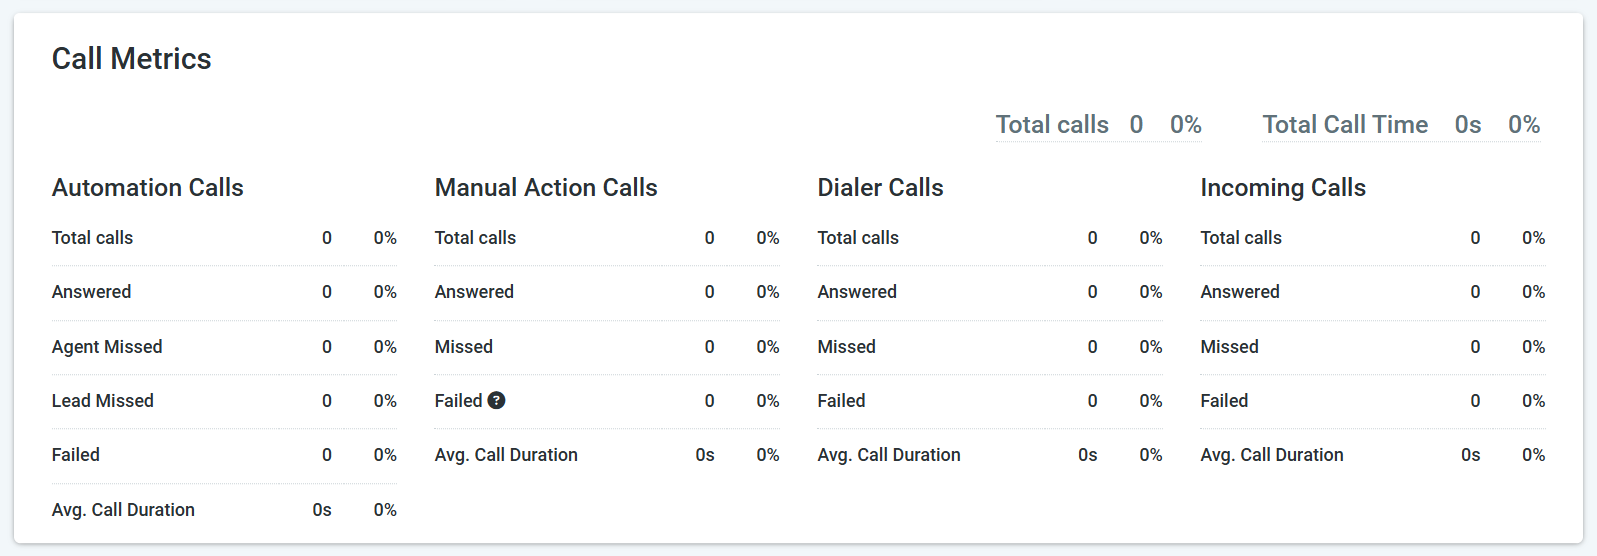
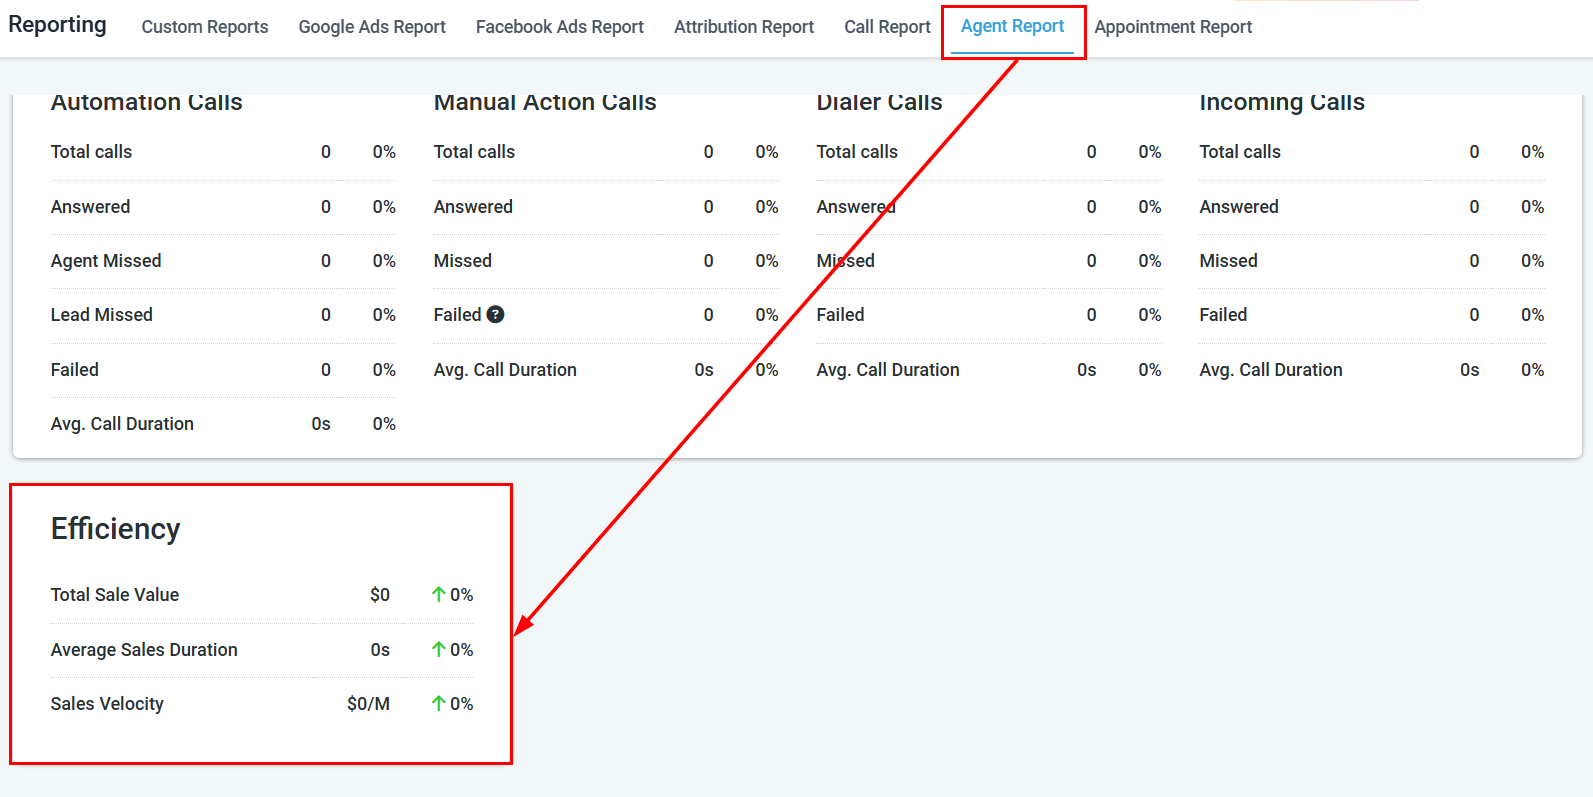
 Agent Call Metrics provides a detailed breakdown of call performance for each agent, essential for improving productivity and the customer experience.
Metrics include:
* **Total calls** — all calls made and received
* **Automation calls** — calls triggered via workflow automations
* **Manual action calls** — calls initiated via manual actions
* **Power dialer calls** — calls made through the power dialer
* **Incoming calls** — inbound call volume
Agent Call Metrics provides a detailed breakdown of call performance for each agent, essential for improving productivity and the customer experience.
Metrics include:
* **Total calls** — all calls made and received
* **Automation calls** — calls triggered via workflow automations
* **Manual action calls** — calls initiated via manual actions
* **Power dialer calls** — calls made through the power dialer
* **Incoming calls** — inbound call volume
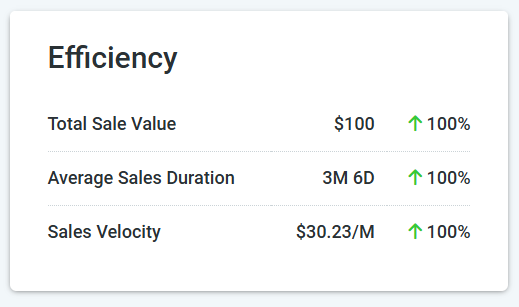
 The Efficiency section highlights key metrics about the outcomes achieved by each agent:
* **Total sales value** — total revenue generated
* **Average sales duration** — how long deals take to close
* **Sales velocity** — deals closed per unit of time
The Efficiency section highlights key metrics about the outcomes achieved by each agent:
* **Total sales value** — total revenue generated
* **Average sales duration** — how long deals take to close
* **Sales velocity** — deals closed per unit of time
 ***
## Sales velocity
Sales velocity measures how quickly your team generates revenue. It combines four factors into a single metric that tells you how much revenue you can expect per day from your pipeline.
### The sales velocity formula
**Sales Velocity = (Number of Deals x Average Deal Value x Win Rate) / Average Sales Cycle Length**
| Factor | What it means |
| ---------------------- | ----------------------------------------------------- |
| **Number of deals** | Total opportunities in the pipeline during the period |
| **Average deal value** | Mean monetary value of opportunities |
| **Win rate** | Percentage of opportunities that close as won |
| **Sales cycle length** | Average days from opportunity creation to close |
### Viewing sales velocity
Sales velocity is displayed in the **Efficiency** section of Agent Reporting. It shows:
* Overall team velocity
* Per-agent velocity for comparison
* Velocity trends over time
### Improving sales velocity
To increase sales velocity, focus on the factor with the most room for improvement:
* **Increase deal volume** — generate more qualified leads
* **Raise average deal value** — upsell or target higher-value prospects
* **Improve win rate** — refine your qualification process and sales scripts
* **Shorten the cycle** — reduce delays between pipeline stages with automation and timely follow-ups
Track sales velocity monthly to measure the impact of process changes. Even small improvements in win rate or cycle length compound significantly over time.
***
## Use cases
Pull individual agent data before a 1:1 or team review. Identify patterns such as low answer rates or long call durations that may need attention.
Compare call and conversation volume across agents to ensure tasks and leads are distributed fairly across your team.
Use the Leaderboard and Efficiency sections to spot which agents are converting the most opportunities or closing deals fastest so you can replicate their approach.
Agent Reporting visibility may be restricted based on your user role. Account users may only see their own data unless granted broader access by an administrator.
***
## Frequently asked questions
Yes. In the **User** dropdown at the top of Agent Reporting, select **All Users** to see aggregated data across your entire team.
Points are based on opportunity outcomes and deal activity. Agents earn points for won deals, completed conversations, and other positive actions tracked by the platform. The exact formula depends on your account configuration.
Account users are typically restricted to viewing their own data. An administrator must grant broader role permissions before you can view other team members' reports.
Total calls includes all calls regardless of how they were initiated. Automation calls are calls triggered by workflow automations, while manual action calls are those the agent initiated directly, and power dialer calls are from the power dialer queue.
Individual sections within Agent Reporting do not have a dedicated export button, but you can build a Custom Report filtering by user to export agent data as a spreadsheet.
Use the **Date Range** selector near the top of the Agent Reporting page. Select your start and end dates to refresh all sections for that period.
***
## Related articles
* [Call reporting](/reporting/call-reporting)
* [Appointment report](/reporting/appointment-report)
* [My staff settings](/settings/my-staff)
***
## Sales velocity
Sales velocity measures how quickly your team generates revenue. It combines four factors into a single metric that tells you how much revenue you can expect per day from your pipeline.
### The sales velocity formula
**Sales Velocity = (Number of Deals x Average Deal Value x Win Rate) / Average Sales Cycle Length**
| Factor | What it means |
| ---------------------- | ----------------------------------------------------- |
| **Number of deals** | Total opportunities in the pipeline during the period |
| **Average deal value** | Mean monetary value of opportunities |
| **Win rate** | Percentage of opportunities that close as won |
| **Sales cycle length** | Average days from opportunity creation to close |
### Viewing sales velocity
Sales velocity is displayed in the **Efficiency** section of Agent Reporting. It shows:
* Overall team velocity
* Per-agent velocity for comparison
* Velocity trends over time
### Improving sales velocity
To increase sales velocity, focus on the factor with the most room for improvement:
* **Increase deal volume** — generate more qualified leads
* **Raise average deal value** — upsell or target higher-value prospects
* **Improve win rate** — refine your qualification process and sales scripts
* **Shorten the cycle** — reduce delays between pipeline stages with automation and timely follow-ups
Track sales velocity monthly to measure the impact of process changes. Even small improvements in win rate or cycle length compound significantly over time.
***
## Use cases
Pull individual agent data before a 1:1 or team review. Identify patterns such as low answer rates or long call durations that may need attention.
Compare call and conversation volume across agents to ensure tasks and leads are distributed fairly across your team.
Use the Leaderboard and Efficiency sections to spot which agents are converting the most opportunities or closing deals fastest so you can replicate their approach.
Agent Reporting visibility may be restricted based on your user role. Account users may only see their own data unless granted broader access by an administrator.
***
## Frequently asked questions
Yes. In the **User** dropdown at the top of Agent Reporting, select **All Users** to see aggregated data across your entire team.
Points are based on opportunity outcomes and deal activity. Agents earn points for won deals, completed conversations, and other positive actions tracked by the platform. The exact formula depends on your account configuration.
Account users are typically restricted to viewing their own data. An administrator must grant broader role permissions before you can view other team members' reports.
Total calls includes all calls regardless of how they were initiated. Automation calls are calls triggered by workflow automations, while manual action calls are those the agent initiated directly, and power dialer calls are from the power dialer queue.
Individual sections within Agent Reporting do not have a dedicated export button, but you can build a Custom Report filtering by user to export agent data as a spreadsheet.
Use the **Date Range** selector near the top of the Agent Reporting page. Select your start and end dates to refresh all sections for that period.
***
## Related articles
* [Call reporting](/reporting/call-reporting)
* [Appointment report](/reporting/appointment-report)
* [My staff settings](/settings/my-staff)