> ## Documentation Index
> Fetch the complete documentation index at: https://help.hoopai.com/llms.txt
> Use this file to discover all available pages before exploring further.
# Ads Reporting
> Monitor Google Ads and Facebook Ads campaign performance — impressions, clicks, conversions, and spend — inside the HoopAI Platform.
The Ads Reporting section brings your Google Ads and Facebook Ads data directly into the HoopAI Platform so you can analyze campaign performance without switching tools. You can also track attribution and conversion data to understand which ad sources are driving results.
## Google Ads reporting
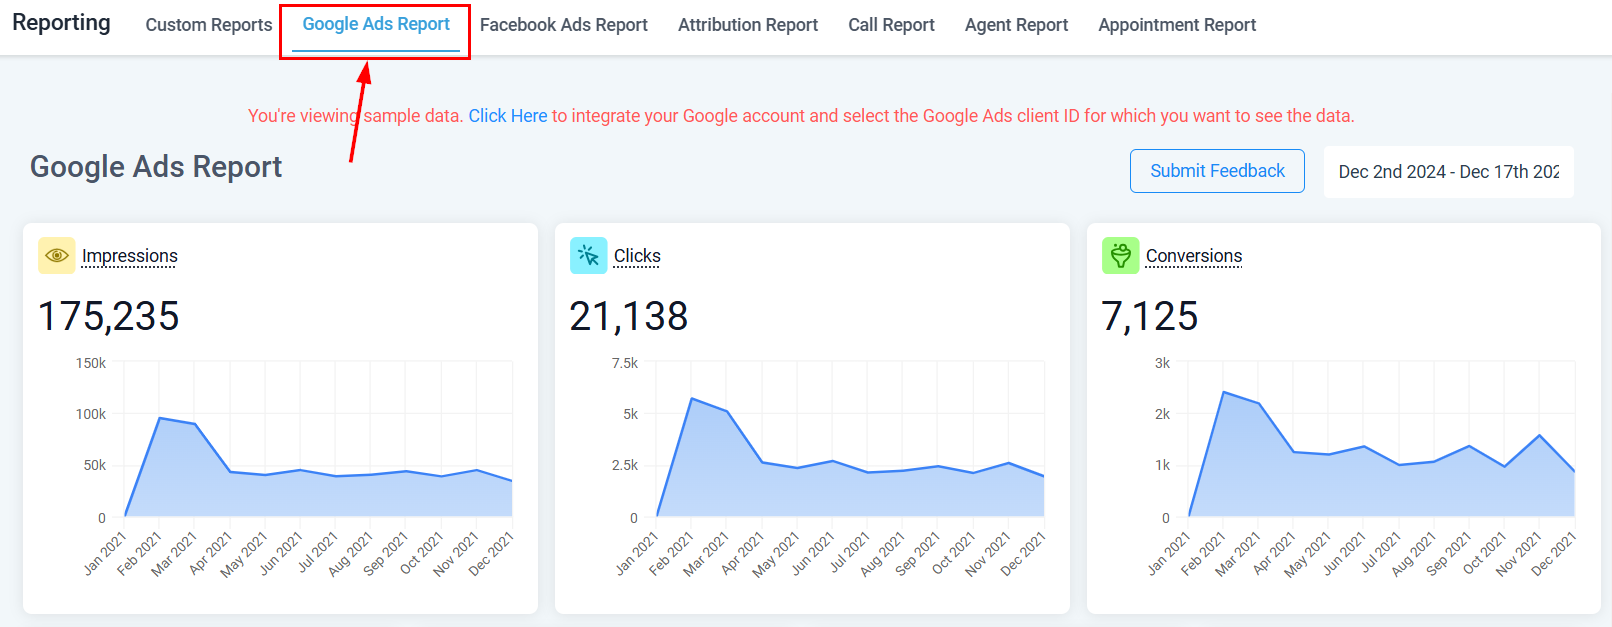
Navigate to **Reporting** in the left sidebar, then select the **Google Ads Reporting** tab.
 ### Key metrics
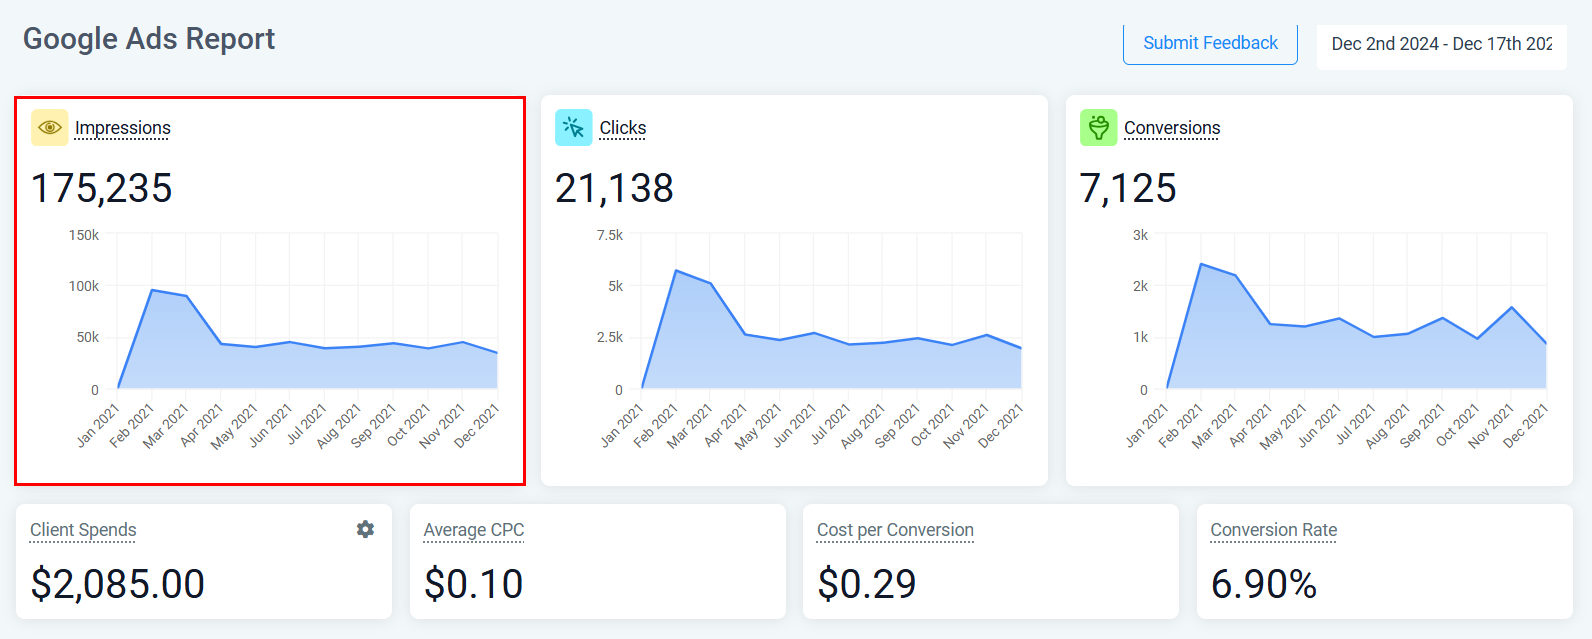
How many times your ads were displayed over the selected date range.
Number of users who clicked your ad, broken down by your chosen date range.
Users who completed the intended action defined by your campaign objective.
Campaign-level stats including client spend, average CPC, cost per conversion, and conversion rate.
### Key metrics
How many times your ads were displayed over the selected date range.
Number of users who clicked your ad, broken down by your chosen date range.
Users who completed the intended action defined by your campaign objective.
Campaign-level stats including client spend, average CPC, cost per conversion, and conversion rate.
 ### Campaign data table
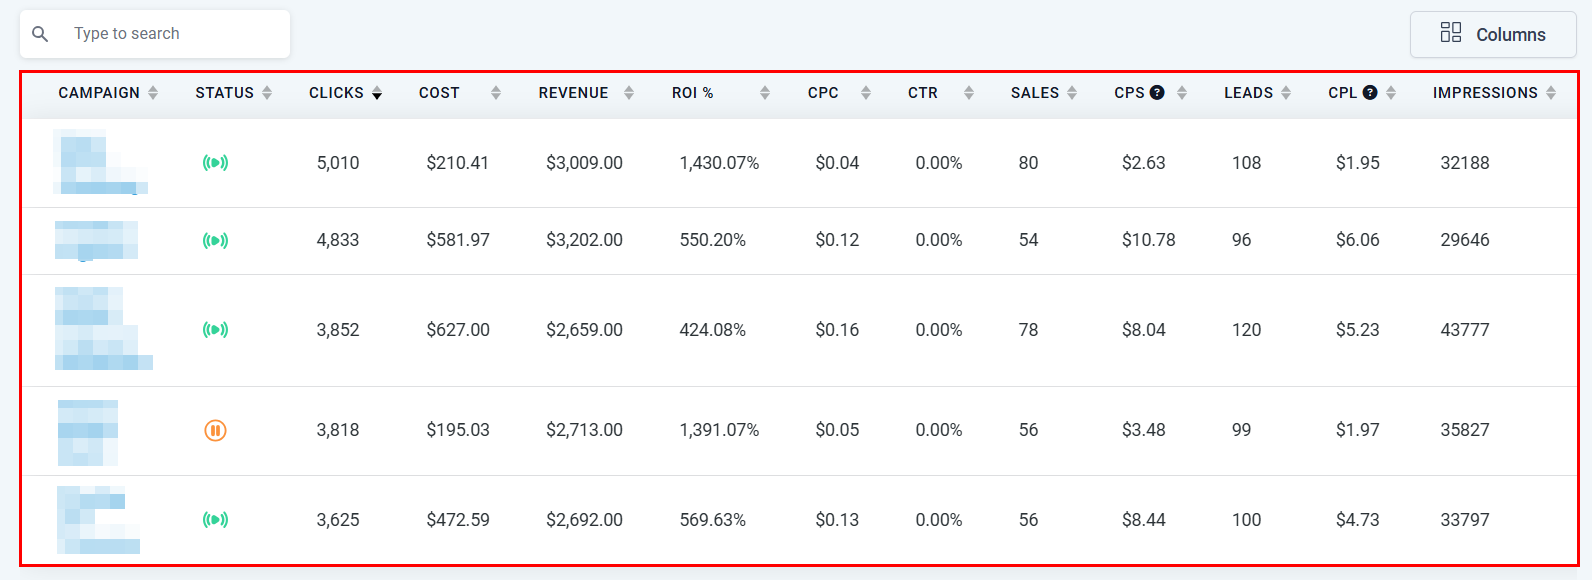
The campaign table shows individual campaign performance with columns including:
* Campaign name and status
* Clicks, cost, revenue, ROI
* Impressions and CPC
* Leads and cost per lead (CPL)
Use the **Search** bar to filter by campaign name, and toggle **Columns** to show or hide metrics.
### Campaign data table
The campaign table shows individual campaign performance with columns including:
* Campaign name and status
* Clicks, cost, revenue, ROI
* Impressions and CPC
* Leads and cost per lead (CPL)
Use the **Search** bar to filter by campaign name, and toggle **Columns** to show or hide metrics.
 ### Selecting a date range
Click the calendar icon in the top-right corner, select your date range, and confirm with the green checkmark to refresh the data.
### Submitting feedback
If you notice discrepancies between the report and your Google Ads account, click **Submit Feedback** to open a sidebar where you can compose a message, add a subject, and attach files.
***
## Facebook Ads reporting
Navigate to **Reporting** in the left sidebar, then select the **Facebook Ads Reporting** tab.
### Selecting a date range
Click the calendar icon in the top-right corner, select your date range, and confirm with the green checkmark to refresh the data.
### Submitting feedback
If you notice discrepancies between the report and your Google Ads account, click **Submit Feedback** to open a sidebar where you can compose a message, add a subject, and attach files.
***
## Facebook Ads reporting
Navigate to **Reporting** in the left sidebar, then select the **Facebook Ads Reporting** tab.
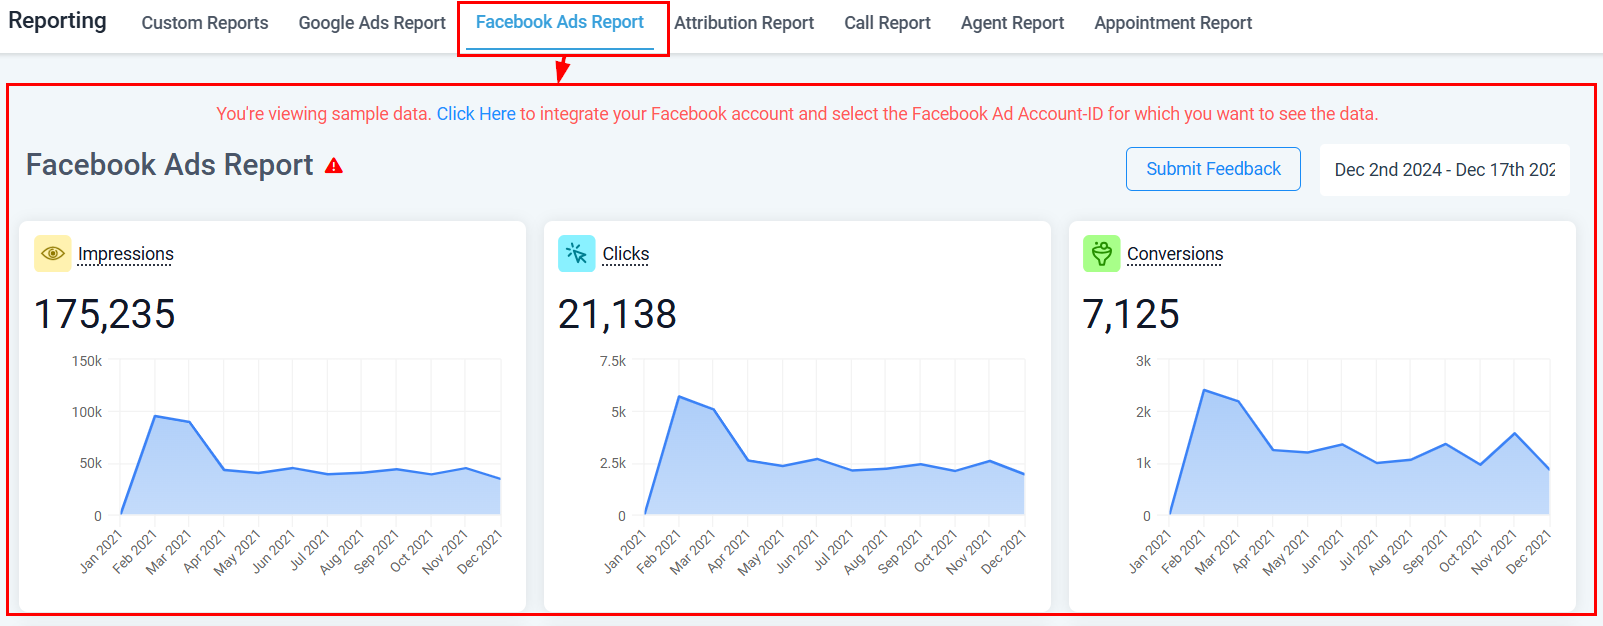 The Facebook Ads Reporting section provides a convenient way to access and analyze your campaign data without logging into Facebook. It tracks performance metrics such as impressions, traffic, and audience engagement.
### Key metrics
The Facebook Ads Reporting section provides a convenient way to access and analyze your campaign data without logging into Facebook. It tracks performance metrics such as impressions, traffic, and audience engagement.
### Key metrics
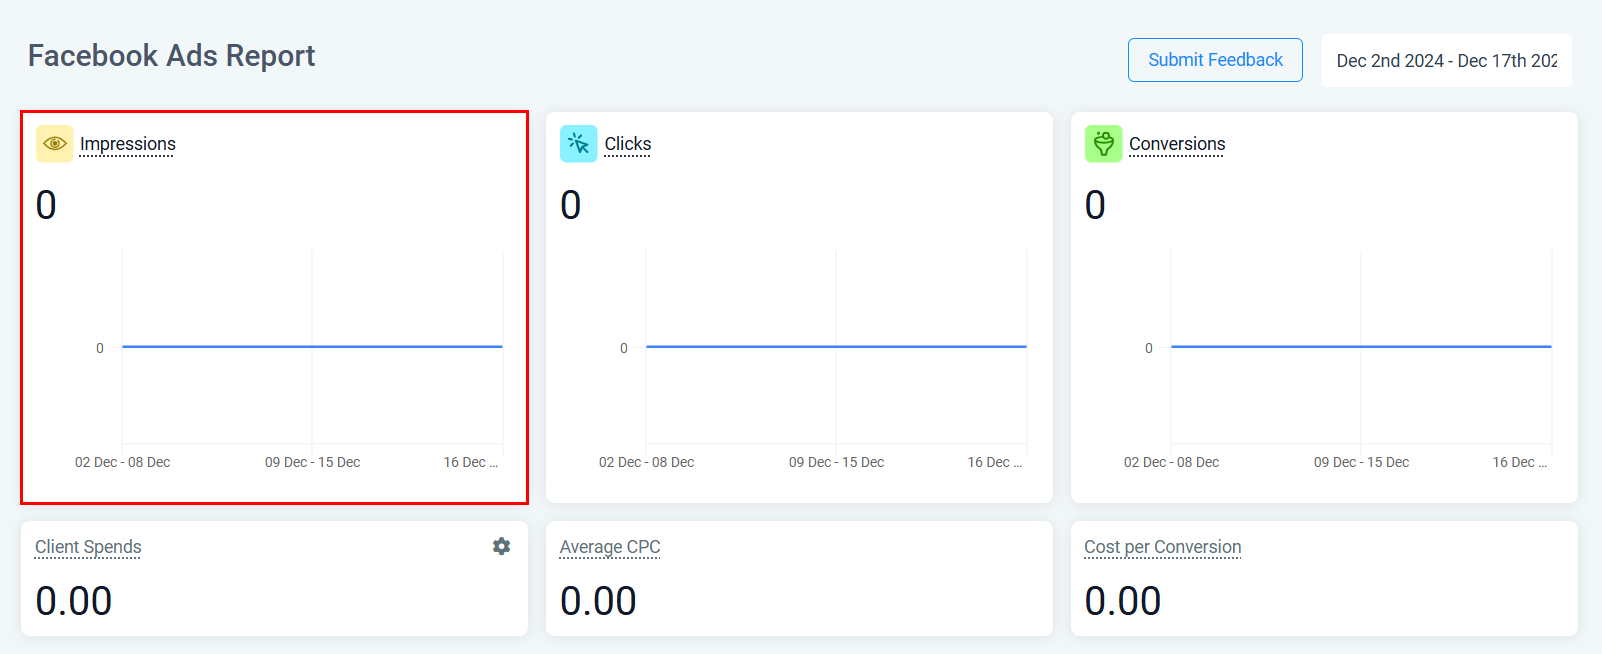
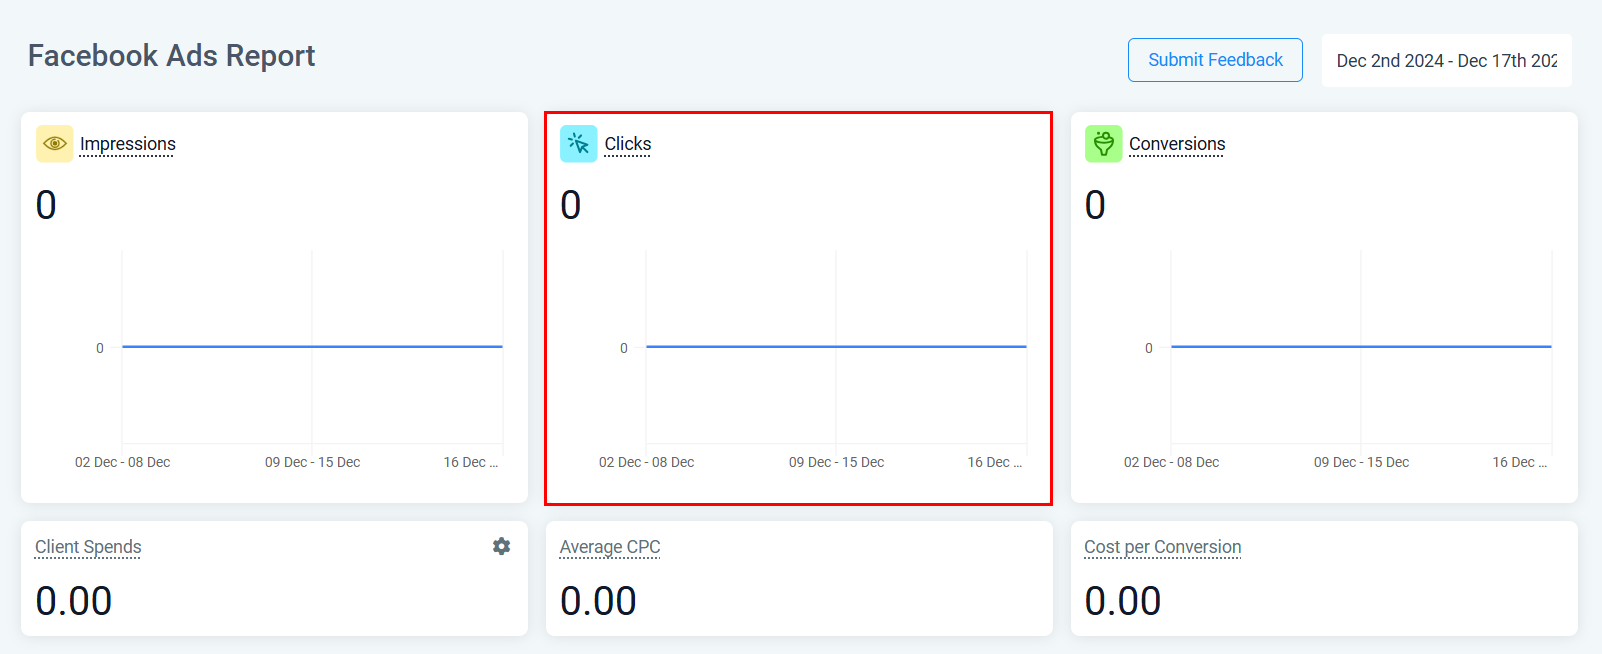 Metrics available include:
* **Impressions** — how many times your ads were shown
* **Clicks** — total ad clicks
* **Conversions** — completed campaign actions
* **Spend** — total ad spend over the period
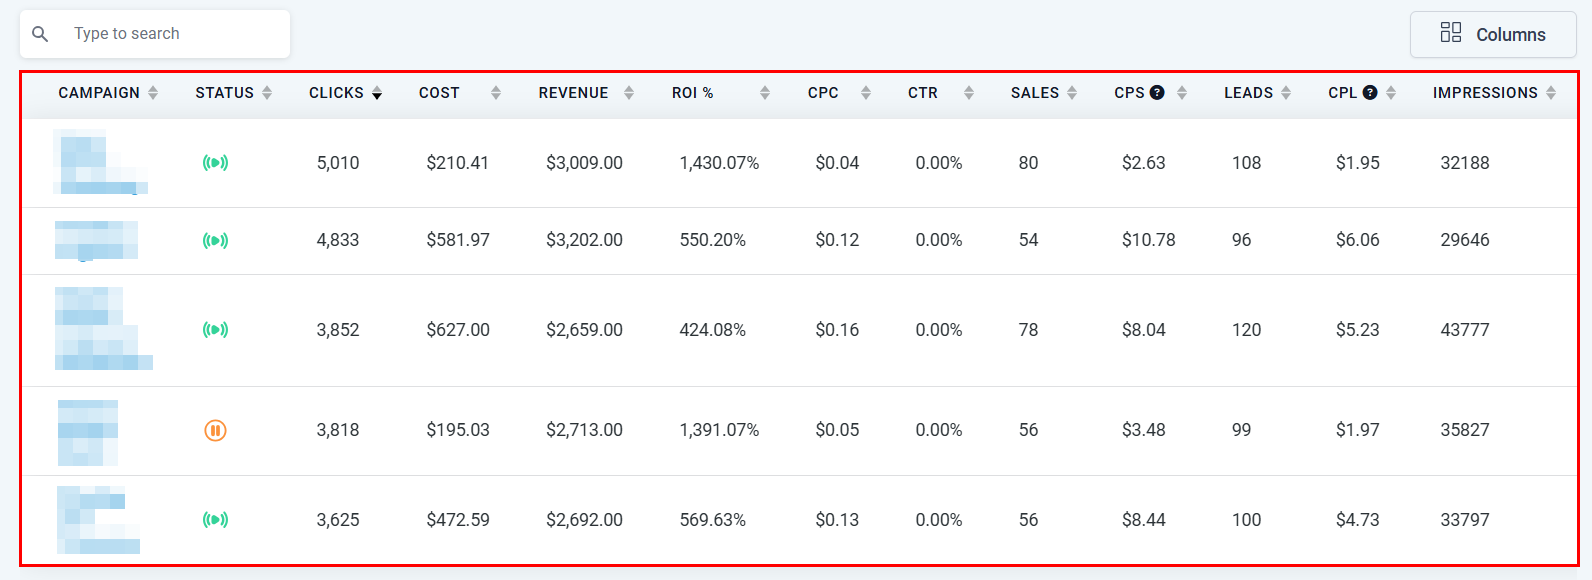
### Ads data table
The table shows campaign, ad set, and ad-level data. Use the search bar to filter by name and the Columns selector to customize visible fields.
Metrics available include:
* **Impressions** — how many times your ads were shown
* **Clicks** — total ad clicks
* **Conversions** — completed campaign actions
* **Spend** — total ad spend over the period
### Ads data table
The table shows campaign, ad set, and ad-level data. Use the search bar to filter by name and the Columns selector to customize visible fields.
 ### Connecting your Facebook account
To populate Facebook Ads data, connect your Facebook account under **Settings → Integrations**. Once connected, campaign data syncs automatically.
Ad reporting data may have a slight delay compared to native Facebook or Google Ads dashboards. If you see discrepancies, allow up to 24 hours for data to sync, or use the Submit Feedback option.
***
## Attribution report
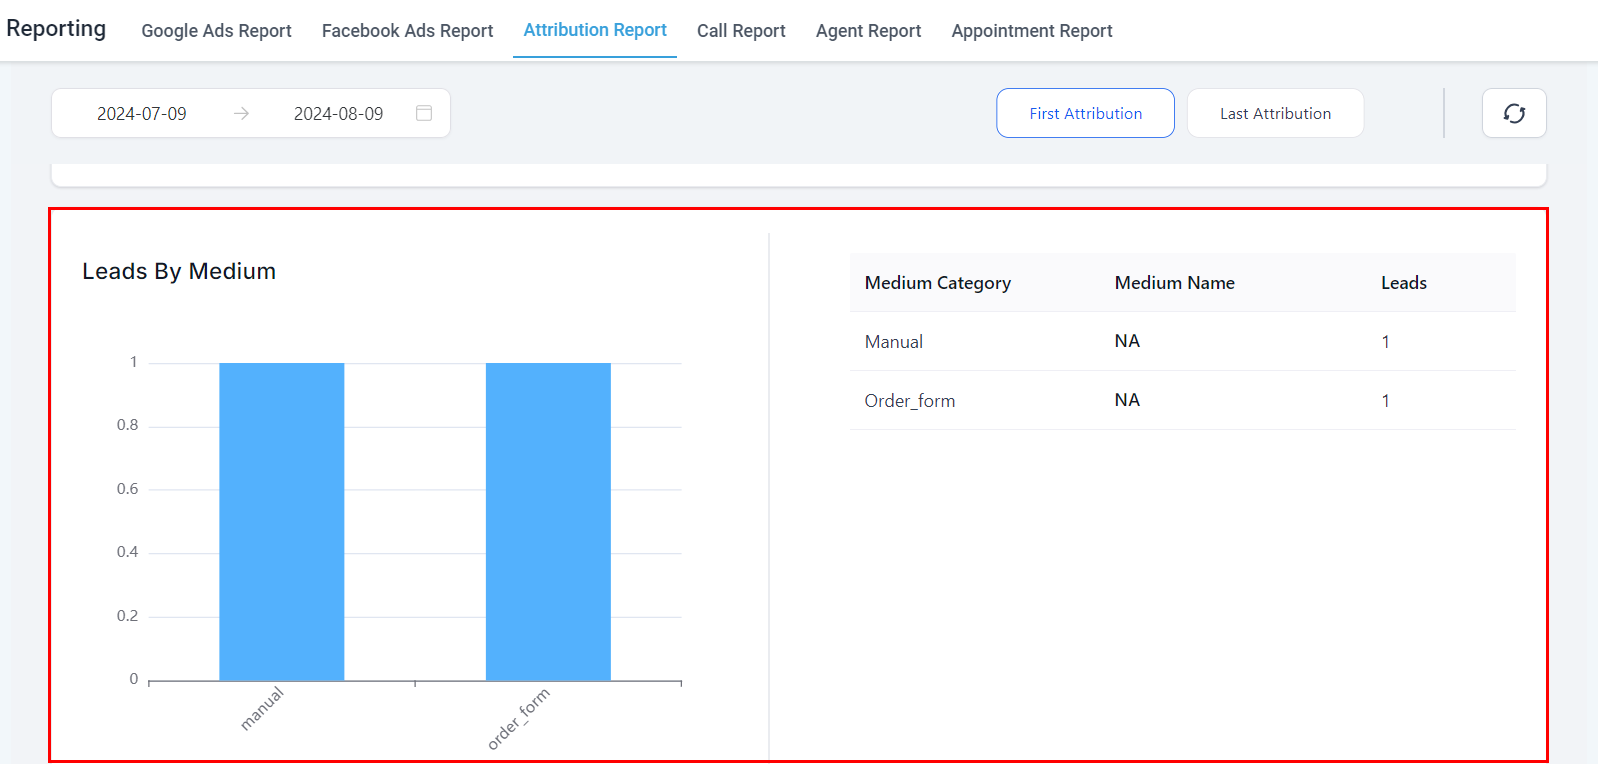
The Attribution Report helps you trace which sources and marketing touchpoints are responsible for converting leads. Navigate to **Reporting → Attribution Report** to see a breakdown.
### Connecting your Facebook account
To populate Facebook Ads data, connect your Facebook account under **Settings → Integrations**. Once connected, campaign data syncs automatically.
Ad reporting data may have a slight delay compared to native Facebook or Google Ads dashboards. If you see discrepancies, allow up to 24 hours for data to sync, or use the Submit Feedback option.
***
## Attribution report
The Attribution Report helps you trace which sources and marketing touchpoints are responsible for converting leads. Navigate to **Reporting → Attribution Report** to see a breakdown.
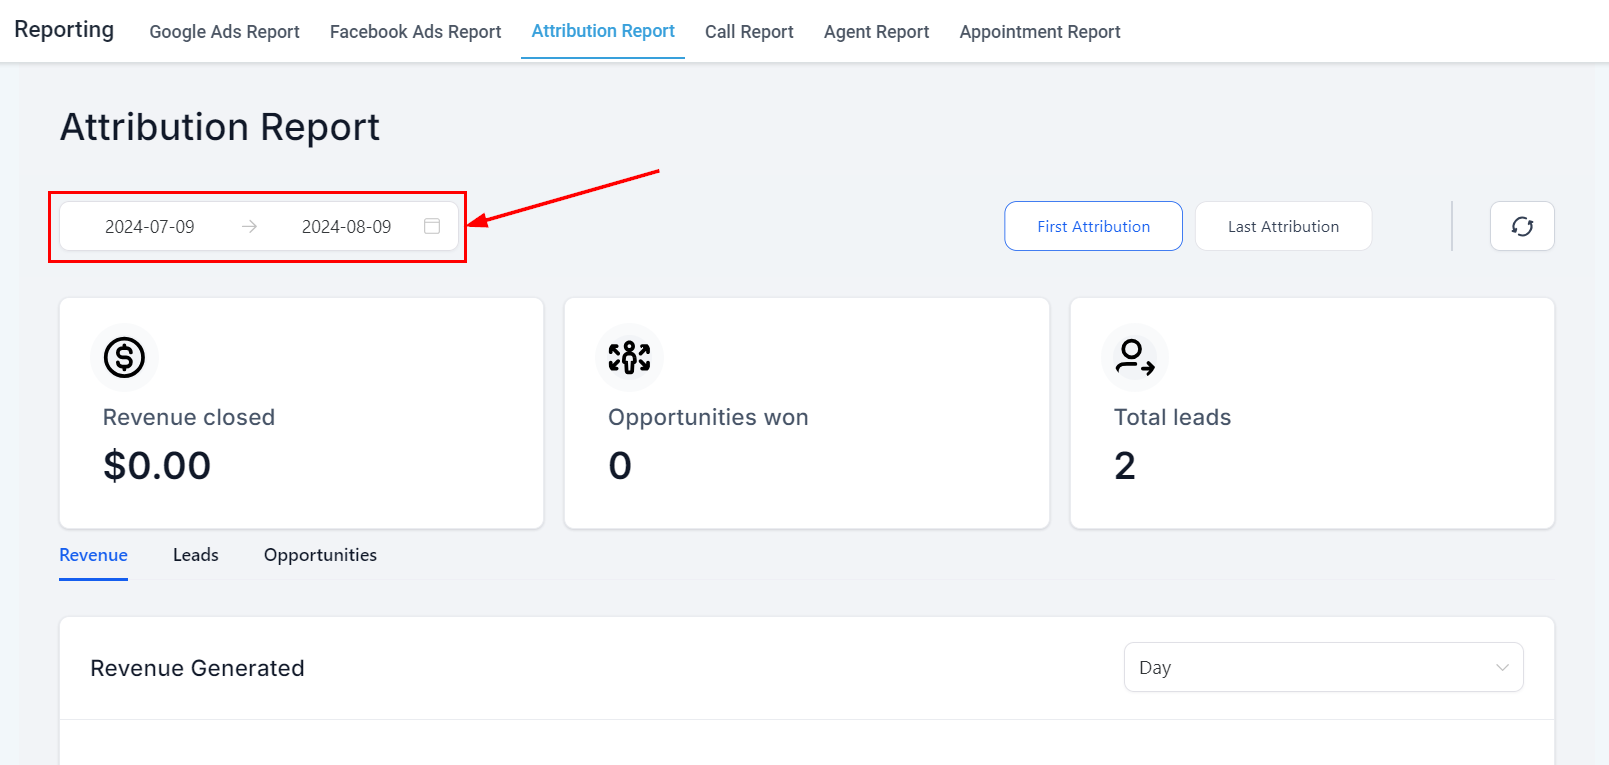
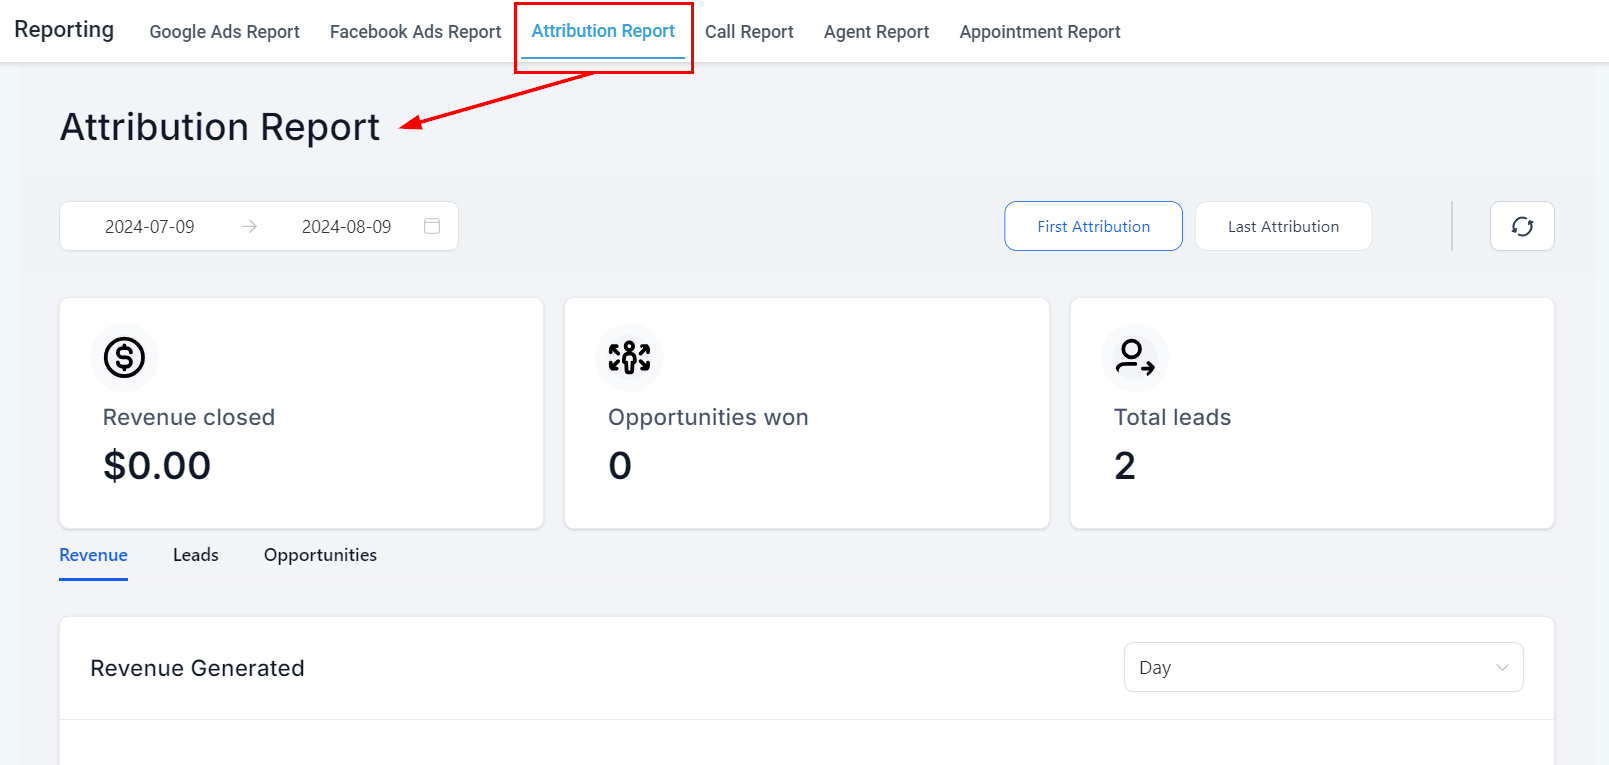 ### Controls
* **Date range** — select any period to analyze attribution data
* **Attribution model** — choose how credit is assigned to touchpoints (first touch, last touch, etc.)
* **Refresh** — update the report to pull the latest data
### Controls
* **Date range** — select any period to analyze attribution data
* **Attribution model** — choose how credit is assigned to touchpoints (first touch, last touch, etc.)
* **Refresh** — update the report to pull the latest data
 ### Key attribution metrics
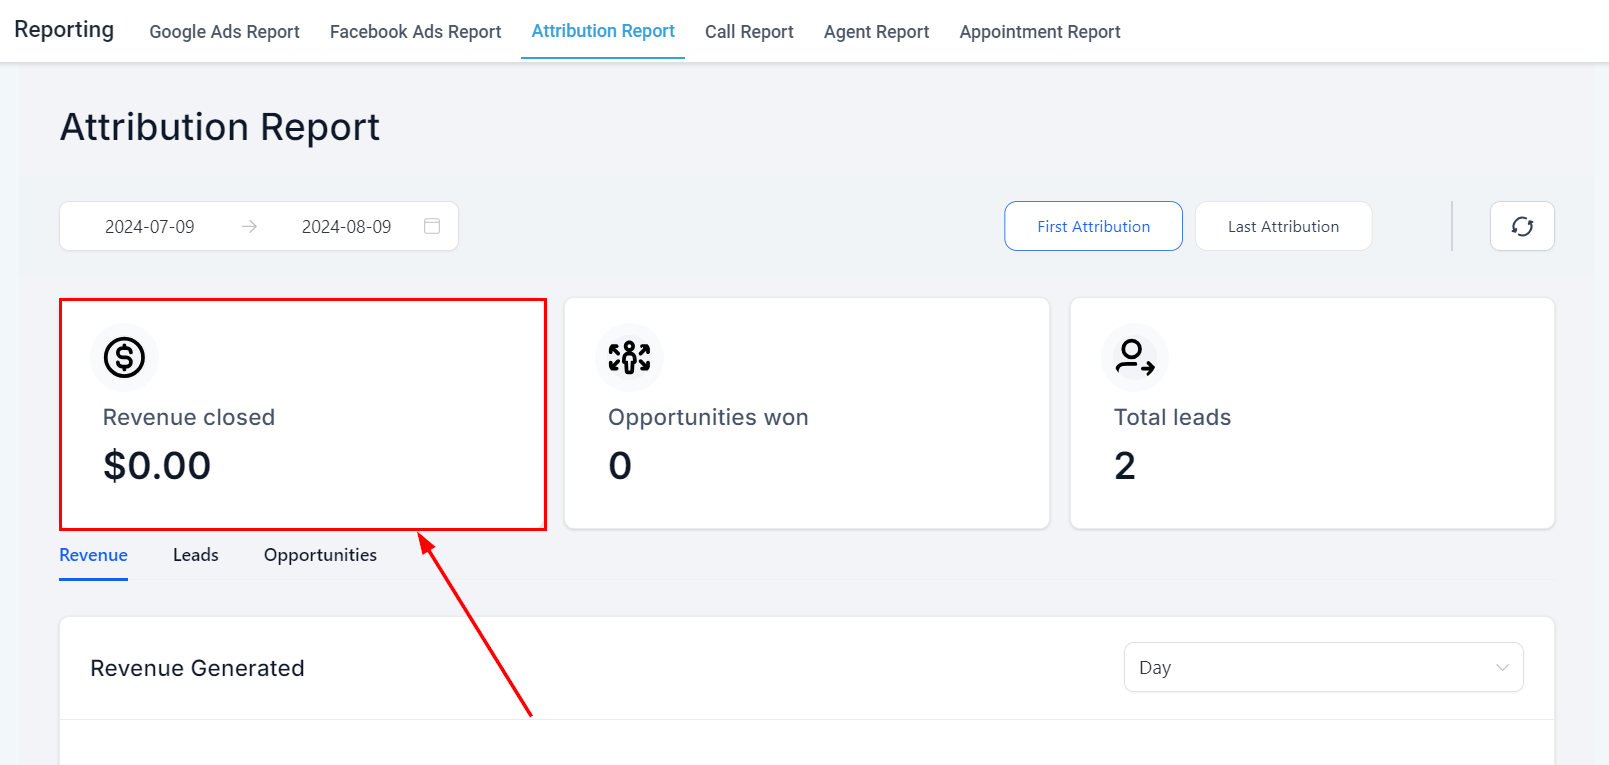
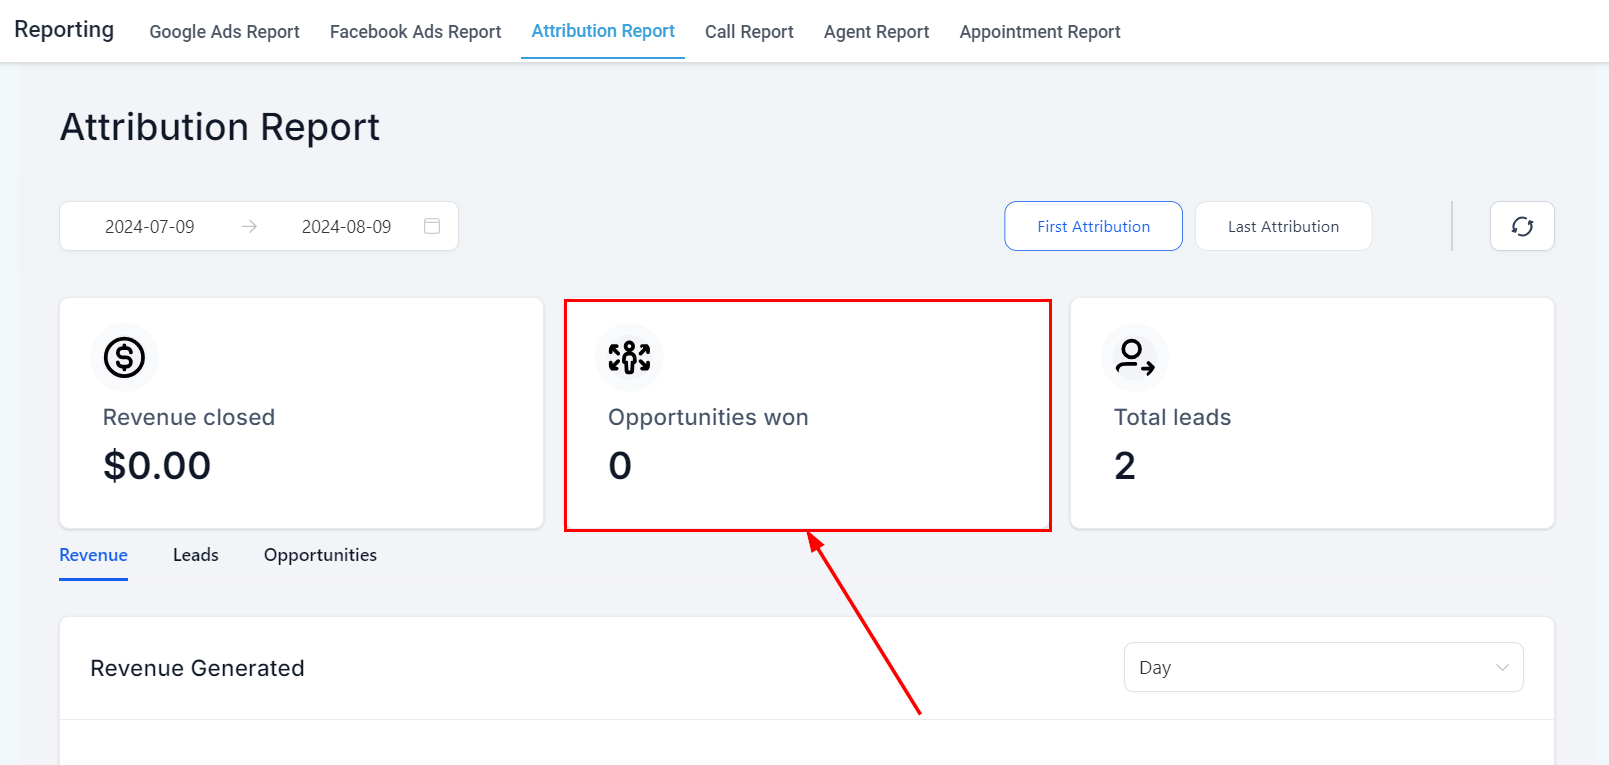
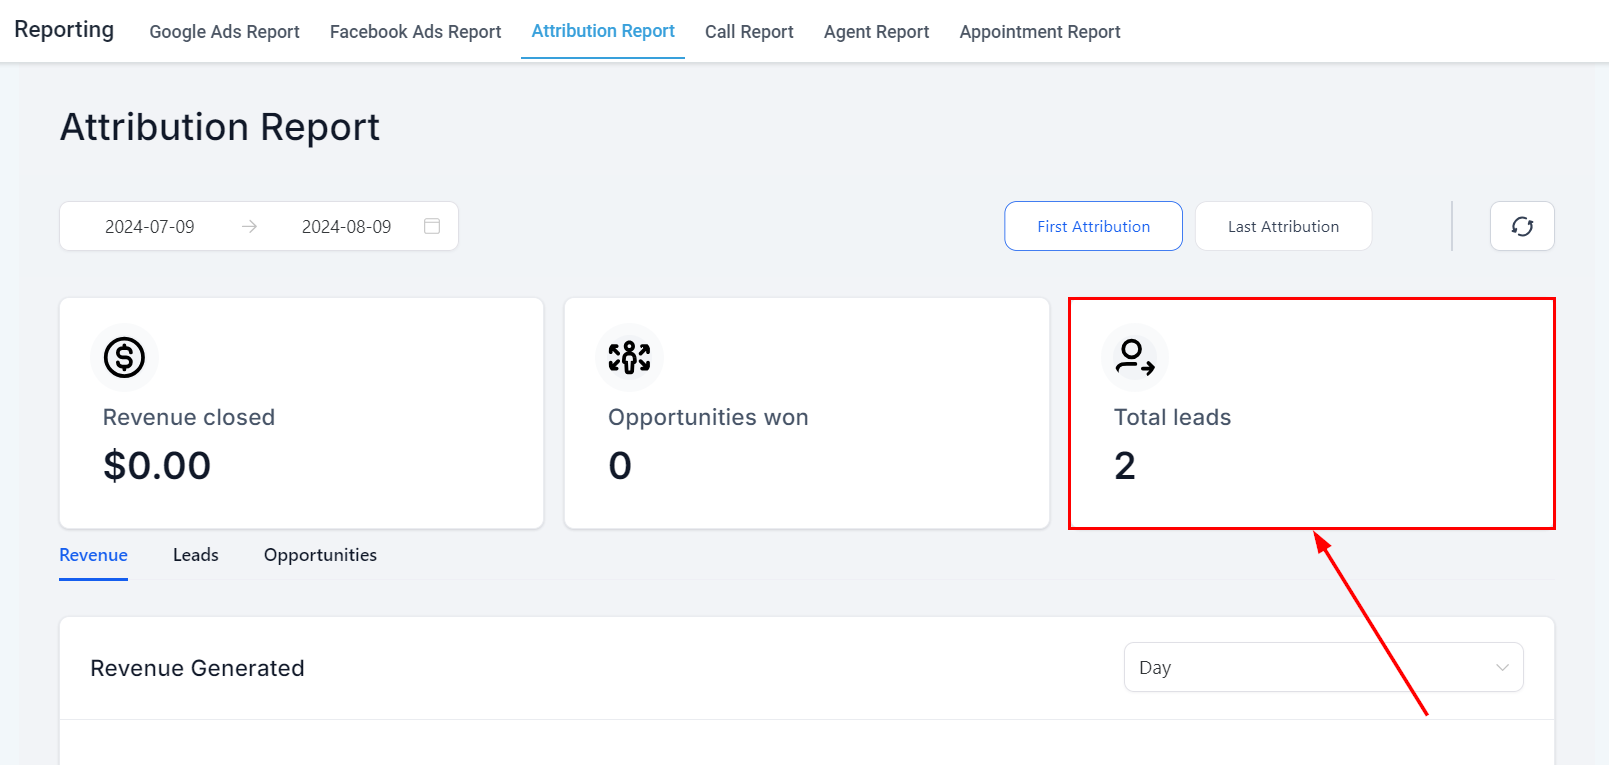
| Metric | Description |
| --------------------- | ------------------------------------------- |
| **Revenue closed** | Total revenue attributed to tracked sources |
| **Opportunities won** | Deals won through attributed channels |
| **Total leads** | Total leads generated per source |
| **Revenue by medium** | Revenue broken down by channel/medium |
### Key attribution metrics
| Metric | Description |
| --------------------- | ------------------------------------------- |
| **Revenue closed** | Total revenue attributed to tracked sources |
| **Opportunities won** | Deals won through attributed channels |
| **Total leads** | Total leads generated per source |
| **Revenue by medium** | Revenue broken down by channel/medium |
 ### Conversion report
The Conversion Report within Attribution tracks and analyzes revenue generated from specific conversion events. Use it to measure how effectively your marketing converts leads into paying customers.
## Frequently asked questions
Connect Google Ads under **Settings → Integrations**. Once authorized, campaign data syncs automatically and appears in the Google Ads Reporting tab.
Go to **Settings → Integrations** and connect your Facebook account. After authorization, your Facebook campaign data will populate in the Facebook Ads Reporting tab.
Ad reporting data may lag behind native Facebook and Google dashboards by up to 24 hours. If discrepancies persist after 24 hours, use the **Submit Feedback** option in Google Ads Reporting to report the issue.
The Attribution Report supports multiple models including first touch, last touch, and linear attribution. Select your preferred model using the **Attribution Model** dropdown within the Attribution Report.
Yes. The Google Ads campaign data table includes a **CPL (cost per lead)** column alongside impressions, clicks, spend, and ROI metrics.
The Conversion Report within Attribution tracks revenue generated from specific conversion events, helping you measure how effectively your marketing converts leads into paying customers.
## Related articles
* [Integrations settings](/settings/integrations)
* [Custom reports](/reporting/custom-reports)
* [Agent reporting](/reporting/agent-reporting)
### Conversion report
The Conversion Report within Attribution tracks and analyzes revenue generated from specific conversion events. Use it to measure how effectively your marketing converts leads into paying customers.
## Frequently asked questions
Connect Google Ads under **Settings → Integrations**. Once authorized, campaign data syncs automatically and appears in the Google Ads Reporting tab.
Go to **Settings → Integrations** and connect your Facebook account. After authorization, your Facebook campaign data will populate in the Facebook Ads Reporting tab.
Ad reporting data may lag behind native Facebook and Google dashboards by up to 24 hours. If discrepancies persist after 24 hours, use the **Submit Feedback** option in Google Ads Reporting to report the issue.
The Attribution Report supports multiple models including first touch, last touch, and linear attribution. Select your preferred model using the **Attribution Model** dropdown within the Attribution Report.
Yes. The Google Ads campaign data table includes a **CPL (cost per lead)** column alongside impressions, clicks, spend, and ROI metrics.
The Conversion Report within Attribution tracks revenue generated from specific conversion events, helping you measure how effectively your marketing converts leads into paying customers.
## Related articles
* [Integrations settings](/settings/integrations)
* [Custom reports](/reporting/custom-reports)
* [Agent reporting](/reporting/agent-reporting)