> ## Documentation Index
> Fetch the complete documentation index at: https://help.hoopai.com/llms.txt
> Use this file to discover all available pages before exploring further.
# Course Analytics
> Track enrollment, completion rates, video watch time, quiz performance, and revenue across all courses in the HoopAI platform.
The HoopAI platform provides multi-layer analytics for your courses and membership content. From a high-level dashboard showing overall performance to granular per-member, per-lesson breakdowns, you have the data you need to understand what is working, where members are dropping off, and how to improve both learning outcomes and revenue.
## Analytics overview
Course analytics are spread across three areas:
| Where to find it | What it shows |
| ------------------------- | ----------------------------------------------------------------------------------------------------- |
| **Courses > Dashboard** | Top-level KPIs: best-performing courses, revenue last 30 days, average order value, enrollment trends |
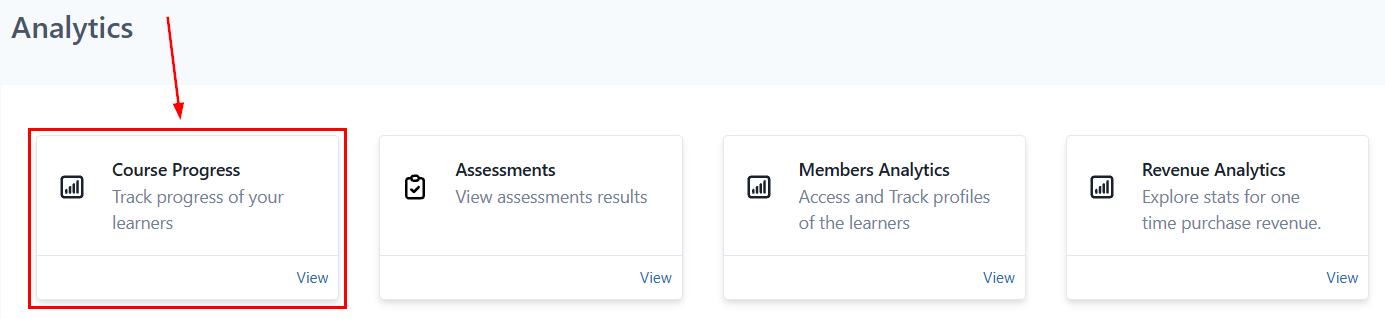
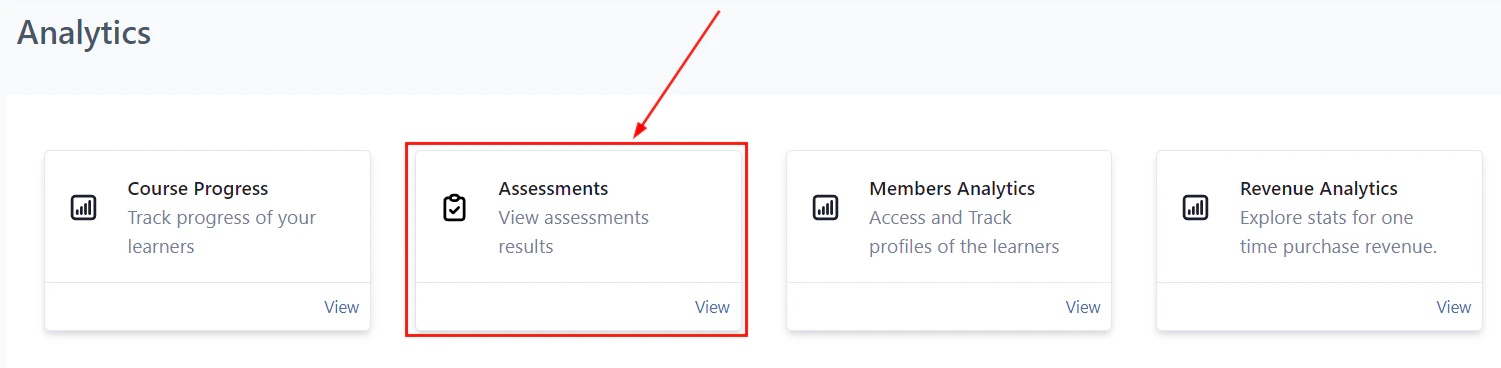
| **Courses > Analytics** | Deep reporting: progress, assessments, revenue, and member data tabs |
| **Courses > Members tab** | Per-member progress for every enrolled course |
Navigate to **Memberships and Communities > Courses** to access all of these views.
***
 ## Courses dashboard
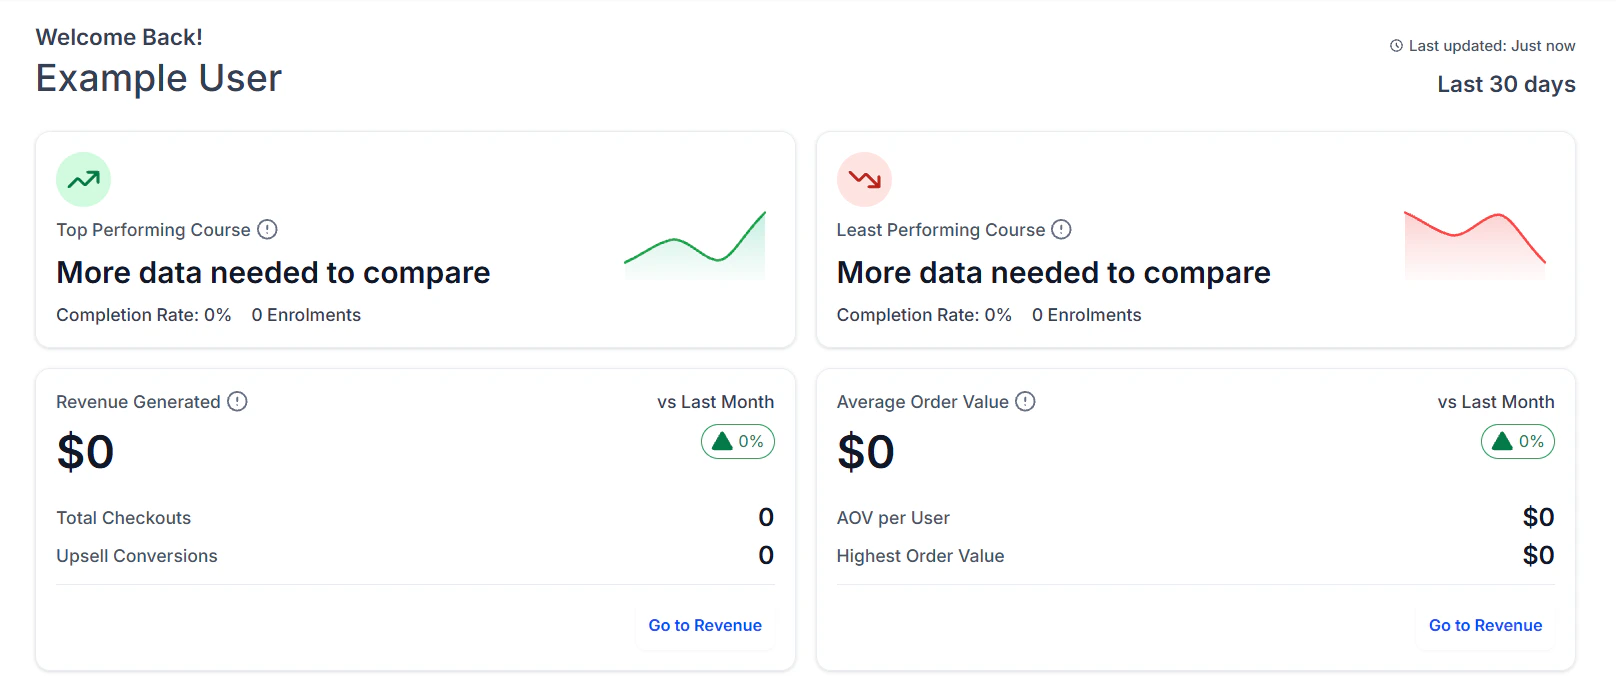
The Dashboard tab is the first screen you see when you open the Courses section. It provides an at-a-glance view of your most important metrics:
* **Best and worst performing courses** — ranked by completion rate or enrollment count
* **Revenue (last 30 days)** — total revenue from course and membership offer purchases
* **Average order value** — mean revenue per transaction across all offers
* **Enrollment trend** — a chart showing new enrollments over the selected time period
* **Active members** — members who have logged in and completed at least one lesson in the last 30 days
Use the date range selector to compare different time periods side by side.
***
## Progress analytics
The **Progress** tab inside Analytics shows completion data across all courses:
* **Course-level completion rate** — the percentage of enrolled members who have completed all lessons in each course
* **Module-level completion** — how far members progress through each module before stopping
* **Average lessons completed per member** — a measure of typical engagement depth
* **Drop-off points** — the specific lessons or modules where the largest percentage of members stop progressing
### Identifying drop-off points
Sort the lesson completion data by completion rate ascending to find the lessons with the lowest completion rates. These are your drop-off points. Common causes:
* The lesson is too long
* The content is confusing or poorly explained
* The quiz is too difficult and blocks members from continuing
* The drip schedule is too slow and members lose momentum
Once identified, prioritize improving those specific lessons — shortening video length, adding a text summary, lowering a quiz passing threshold, or reducing the drip delay.
***
## Video watch time
For video lessons hosted directly on the HoopAI platform, the analytics panel reports:
* **Average watch percentage** — how much of each video members typically watch before stopping or skipping
* **Total minutes watched** — cumulative watch time across all members for each video lesson
* **Watch completion rate** — the percentage of members who watch past the completion threshold (e.g. 80%)
Low average watch percentages on a specific lesson are a direct signal that the content needs attention — either the topic is less relevant or the presentation style is not landing.
Video watch time analytics are available for videos uploaded directly to the HoopAI platform. Videos embedded from YouTube, Vimeo, or Wistia report watch data through those platforms' own analytics dashboards rather than through the HoopAI interface.
***
## Assessment analytics
The **Assessments** tab shows quiz performance data across all courses:
* **Pass rate per quiz** — the percentage of members who achieve the passing score on the first attempt
* **Average score** — the mean score across all member attempts
* **Score distribution** — a histogram showing how scores cluster (e.g. most members scoring 70–80%)
* **Retake rate** — how many members required more than one attempt to pass
* **Common wrong answers** — for multiple-choice questions, the answer options members choose most when they get a question wrong
## Courses dashboard
The Dashboard tab is the first screen you see when you open the Courses section. It provides an at-a-glance view of your most important metrics:
* **Best and worst performing courses** — ranked by completion rate or enrollment count
* **Revenue (last 30 days)** — total revenue from course and membership offer purchases
* **Average order value** — mean revenue per transaction across all offers
* **Enrollment trend** — a chart showing new enrollments over the selected time period
* **Active members** — members who have logged in and completed at least one lesson in the last 30 days
Use the date range selector to compare different time periods side by side.
***
## Progress analytics
The **Progress** tab inside Analytics shows completion data across all courses:
* **Course-level completion rate** — the percentage of enrolled members who have completed all lessons in each course
* **Module-level completion** — how far members progress through each module before stopping
* **Average lessons completed per member** — a measure of typical engagement depth
* **Drop-off points** — the specific lessons or modules where the largest percentage of members stop progressing
### Identifying drop-off points
Sort the lesson completion data by completion rate ascending to find the lessons with the lowest completion rates. These are your drop-off points. Common causes:
* The lesson is too long
* The content is confusing or poorly explained
* The quiz is too difficult and blocks members from continuing
* The drip schedule is too slow and members lose momentum
Once identified, prioritize improving those specific lessons — shortening video length, adding a text summary, lowering a quiz passing threshold, or reducing the drip delay.
***
## Video watch time
For video lessons hosted directly on the HoopAI platform, the analytics panel reports:
* **Average watch percentage** — how much of each video members typically watch before stopping or skipping
* **Total minutes watched** — cumulative watch time across all members for each video lesson
* **Watch completion rate** — the percentage of members who watch past the completion threshold (e.g. 80%)
Low average watch percentages on a specific lesson are a direct signal that the content needs attention — either the topic is less relevant or the presentation style is not landing.
Video watch time analytics are available for videos uploaded directly to the HoopAI platform. Videos embedded from YouTube, Vimeo, or Wistia report watch data through those platforms' own analytics dashboards rather than through the HoopAI interface.
***
## Assessment analytics
The **Assessments** tab shows quiz performance data across all courses:
* **Pass rate per quiz** — the percentage of members who achieve the passing score on the first attempt
* **Average score** — the mean score across all member attempts
* **Score distribution** — a histogram showing how scores cluster (e.g. most members scoring 70–80%)
* **Retake rate** — how many members required more than one attempt to pass
* **Common wrong answers** — for multiple-choice questions, the answer options members choose most when they get a question wrong
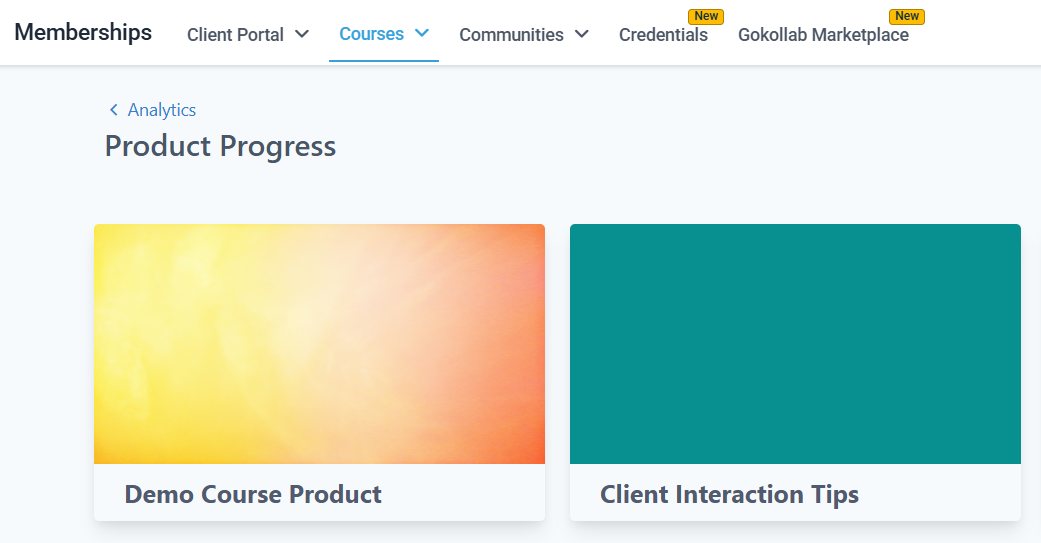 Use assessment analytics to refine your quizzes. If more than 40% of members fail a quiz on the first attempt, review whether the question wording is clear, the material was covered sufficiently in the preceding lessons, or the passing threshold is set too high.
***
Use assessment analytics to refine your quizzes. If more than 40% of members fail a quiz on the first attempt, review whether the question wording is clear, the material was covered sufficiently in the preceding lessons, or the passing threshold is set too high.
***
 ## Revenue analytics
The **Revenue** tab tracks financial performance of your courses and membership offers:
* **Total revenue** — gross revenue from all offer purchases in the selected time period
* **Revenue by offer** — a breakdown showing which offers generate the most income
* **Revenue by course** — when courses are sold individually, shows which content drives the most sales
* **New vs recurring revenue** — separates first-time purchases from recurring subscription charges
* **Refunds** — tracks refund transactions and the net revenue impact
Export revenue data as a CSV from the Revenue tab for use in your accounting or financial reporting tools.
***
## Revenue analytics
The **Revenue** tab tracks financial performance of your courses and membership offers:
* **Total revenue** — gross revenue from all offer purchases in the selected time period
* **Revenue by offer** — a breakdown showing which offers generate the most income
* **Revenue by course** — when courses are sold individually, shows which content drives the most sales
* **New vs recurring revenue** — separates first-time purchases from recurring subscription charges
* **Refunds** — tracks refund transactions and the net revenue impact
Export revenue data as a CSV from the Revenue tab for use in your accounting or financial reporting tools.
***
 ## Member data analytics
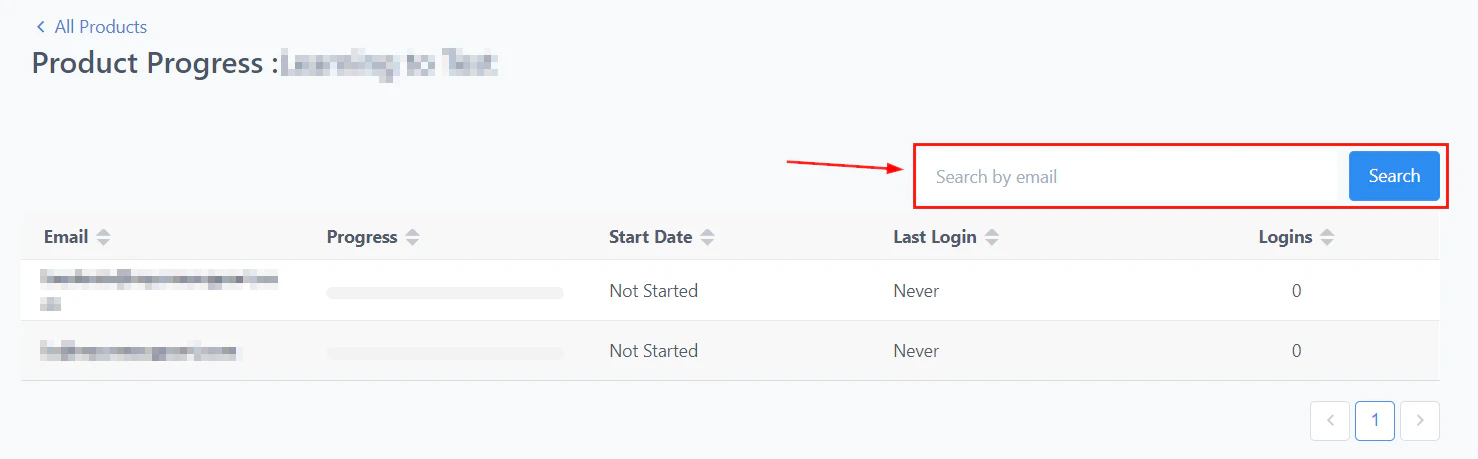
The **Member Data** tab provides a record of every enrolled member across all courses:
| Column | Description |
| ----------------- | --------------------------------------------------------------------- |
| Member name | The member's display name and email address |
| Offer | The offer through which they gained access |
| Enrollment date | The date and time access was first granted |
| Last active | The most recent date the member logged in and interacted with content |
| Lessons completed | The count of lessons marked complete out of the total available |
| Completion % | Percentage of total lessons completed |
| Quiz scores | A summary of scores for each quiz the member has attempted |
## Member data analytics
The **Member Data** tab provides a record of every enrolled member across all courses:
| Column | Description |
| ----------------- | --------------------------------------------------------------------- |
| Member name | The member's display name and email address |
| Offer | The offer through which they gained access |
| Enrollment date | The date and time access was first granted |
| Last active | The most recent date the member logged in and interacted with content |
| Lessons completed | The count of lessons marked complete out of the total available |
| Completion % | Percentage of total lessons completed |
| Quiz scores | A summary of scores for each quiz the member has attempted |
 ### Filtering member data
Use filters to segment the member data view:
* **By course** — show members enrolled in a specific course only
* **By completion status** — filter for members at 0%, 1–99%, or 100% completion
* **By date range** — focus on members who enrolled or were last active in a specific window
* **By offer** — filter by the offer used to access the content
### Exporting member data
Click **Export** in the Member Data tab to download a CSV of the filtered dataset. The export includes all columns visible in the tab. Use this data to:
* Identify members who have stalled and trigger a re-engagement automation
* Report on cohort outcomes to sponsors or stakeholders
* Reconcile enrollment records with payment data
***
## Using analytics to trigger automations
Connect your analytics insights to automated actions:
| Insight | Automation response |
| ----------------------------------------- | ---------------------------------------------------- |
| Member reaches 0% completion after 7 days | Send a re-engagement email with a direct course link |
| Member completes 50% of lessons | Send a "halfway there" encouragement email |
| Member fails a quiz twice | Send a study guide or offer a 1:1 coaching call |
| Member completes the course | Issue a certificate and send a congratulations email |
| Revenue drops below threshold | Alert the admin team via internal notification |
Build these workflows in **Automation** using the course progress triggers: **Lesson Completed**, **Assessment Passed**, **Assessment Failed**, and **Course Completed**.
***
## Frequently asked questions
Analytics data in the HoopAI platform updates in near real time. Progress events (lesson completions, quiz submissions) appear in the analytics within a few minutes. Revenue data may have a short delay depending on payment gateway processing.
Yes. Click the member's name in the Members tab to open their detail view. It shows a lesson-by-lesson breakdown: which lessons are completed (with the date completed), which the member has started but not yet completed, and which they have not yet accessed.
Yes. In the Member Data tab, filter by enrollment date to show only members who enrolled in a specific month or date range. The completion rate visible for that filtered set reflects the cohort's performance.
Community engagement data (post counts, reaction totals, active members, leaderboard positions) is available in the community analytics panel within the Communities section. Course progress analytics and community engagement analytics are currently in separate sections of the platform.
Analytics access is tied to the user role within your HoopAI account. Account admins and users with the appropriate permissions can access the Courses analytics dashboard. Review your team's user roles under **Settings > My Staff** to ensure the right people have access.
### Filtering member data
Use filters to segment the member data view:
* **By course** — show members enrolled in a specific course only
* **By completion status** — filter for members at 0%, 1–99%, or 100% completion
* **By date range** — focus on members who enrolled or were last active in a specific window
* **By offer** — filter by the offer used to access the content
### Exporting member data
Click **Export** in the Member Data tab to download a CSV of the filtered dataset. The export includes all columns visible in the tab. Use this data to:
* Identify members who have stalled and trigger a re-engagement automation
* Report on cohort outcomes to sponsors or stakeholders
* Reconcile enrollment records with payment data
***
## Using analytics to trigger automations
Connect your analytics insights to automated actions:
| Insight | Automation response |
| ----------------------------------------- | ---------------------------------------------------- |
| Member reaches 0% completion after 7 days | Send a re-engagement email with a direct course link |
| Member completes 50% of lessons | Send a "halfway there" encouragement email |
| Member fails a quiz twice | Send a study guide or offer a 1:1 coaching call |
| Member completes the course | Issue a certificate and send a congratulations email |
| Revenue drops below threshold | Alert the admin team via internal notification |
Build these workflows in **Automation** using the course progress triggers: **Lesson Completed**, **Assessment Passed**, **Assessment Failed**, and **Course Completed**.
***
## Frequently asked questions
Analytics data in the HoopAI platform updates in near real time. Progress events (lesson completions, quiz submissions) appear in the analytics within a few minutes. Revenue data may have a short delay depending on payment gateway processing.
Yes. Click the member's name in the Members tab to open their detail view. It shows a lesson-by-lesson breakdown: which lessons are completed (with the date completed), which the member has started but not yet completed, and which they have not yet accessed.
Yes. In the Member Data tab, filter by enrollment date to show only members who enrolled in a specific month or date range. The completion rate visible for that filtered set reflects the cohort's performance.
Community engagement data (post counts, reaction totals, active members, leaderboard positions) is available in the community analytics panel within the Communities section. Course progress analytics and community engagement analytics are currently in separate sections of the platform.
Analytics access is tied to the user role within your HoopAI account. Account admins and users with the appropriate permissions can access the Courses analytics dashboard. Review your team's user roles under **Settings > My Staff** to ensure the right people have access.