> ## Documentation Index
> Fetch the complete documentation index at: https://help.hoopai.com/llms.txt
> Use this file to discover all available pages before exploring further.
# Revenue widget
> Track total revenue, transaction counts, payment trends, and payment status breakdowns on your dashboard with the Payments widget category.
Revenue widgets surface your financial performance directly on the HoopAI platform dashboard. By connecting to your payment data, these widgets give you a real-time view of revenue collected, transaction volume, recurring versus one-time payments, and payment status breakdowns — all without leaving the dashboard.
## What revenue widgets track
Revenue widgets pull data from the Payments section of the HoopAI platform and surface key financial metrics:
* **Total revenue** — the sum of all completed payments within the selected date range
* **Total transactions** — the count of individual payment transactions processed
* **Revenue over time** — a trend visualization showing how revenue fluctuates day by day, week by week, or month by month
* **Payment status breakdown** — distribution of payments by status (paid, pending, failed, refunded)
* **Revenue by product or service** — breakdown of revenue attributed to specific products, subscriptions, or invoice line items
## Adding a revenue widget
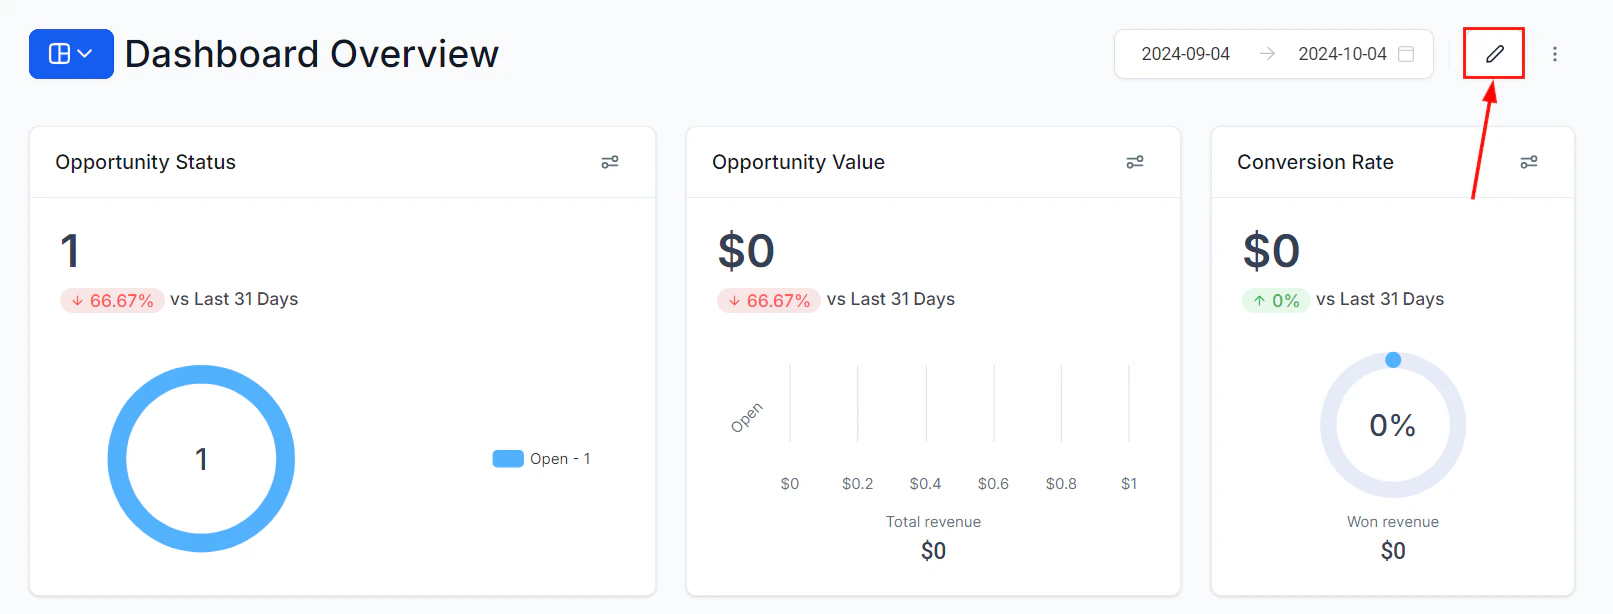 Navigate to your dashboard and click the **pencil icon** to enter edit mode.
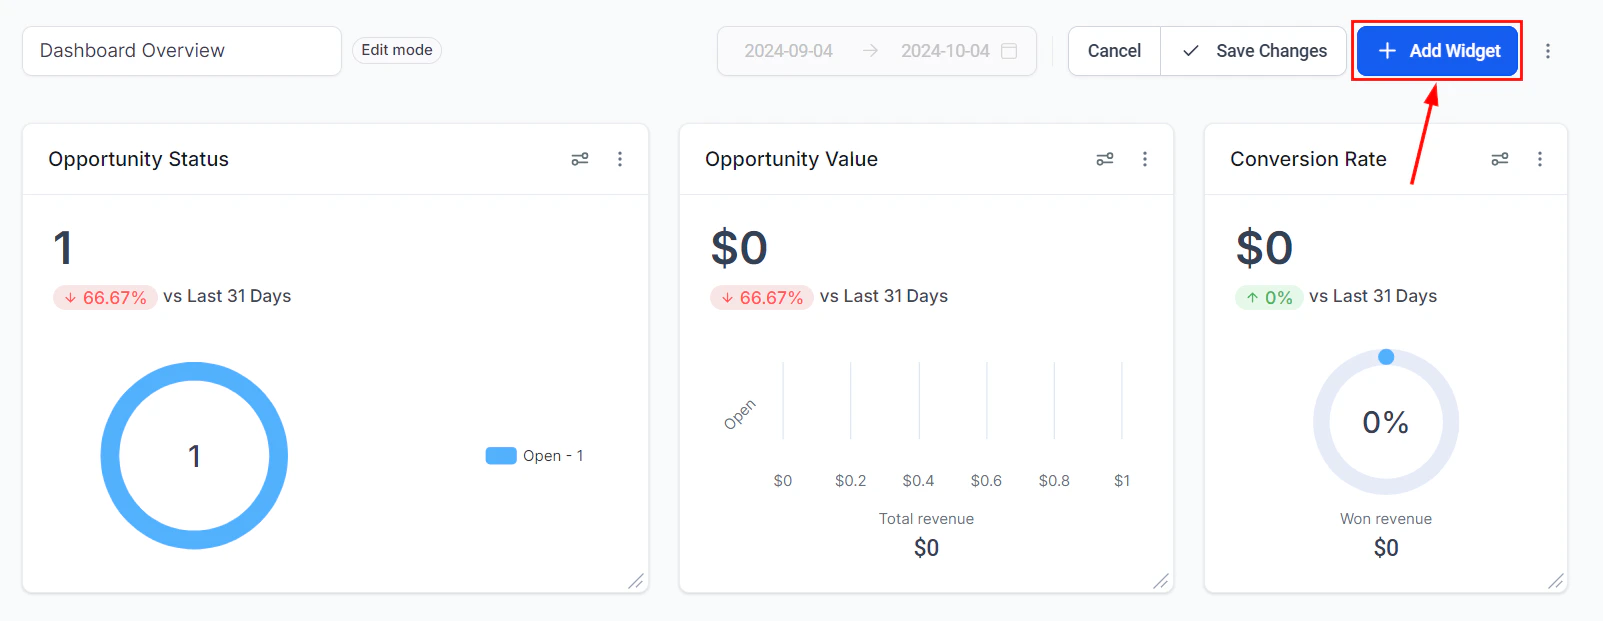
Click **"Add Widget"** to open the widget selection panel.
Navigate to your dashboard and click the **pencil icon** to enter edit mode.
Click **"Add Widget"** to open the widget selection panel.
 Click the **Payments** tab in the widget panel to browse all available revenue and payment widgets.
Select the widget that matches your reporting need — for example, **Total Revenue** for a KPI tile or **Revenue Over Time** for a trend line.
Click the **three dots** on the widget and select **Edit** to configure the title, metrics, date range, and any conditions. Click **Save**, then **Save Changes**.
## Available payment widget types
| Widget type | Description |
| ---------------------------- | --------------------------------------------------------------------- |
| **Total revenue** | Sum of all completed payment amounts within the selected period |
| **Total transactions** | Count of all processed payment transactions |
| **Revenue over time** | Line or bar chart trending revenue across the date range |
| **Payment status breakdown** | Donut or bar chart showing paid, pending, failed, and refunded counts |
## Configuring the total revenue widget
The total revenue widget is the most commonly used payment widget. When configuring it:
**Metrics:** Select **Sum** as the metric and choose the revenue amount field. This gives you the total dollar amount collected within the selected period.
**Date range:** By default, the widget uses the dashboard's global time frame. Apply a **Date Range Override** to lock the widget to a specific period — for example, always showing the current month's revenue regardless of what the global date selector is set to.
**Comparison date range:** Enable a comparison period to show revenue alongside the prior period's figure. This adds a percentage change indicator that immediately shows whether revenue is up or down versus the comparison period.
Pair a total revenue numeric widget with a revenue over time line chart widget side by side. The numeric tile gives the summary number while the line chart provides the trend context — together they tell a more complete story than either widget alone.
## Filtering revenue widgets
Use the **Conditions** tab to segment your payment data:
Add a **Payment Status** condition to isolate specific transaction states. Common uses include a "Pending Payments" widget (filter to Pending status) placed alongside a "Collected Revenue" widget (filter to Paid status) to show outstanding versus received amounts.
If your account uses products or services in invoices and payment links, add a **Product** condition to show revenue from a specific offering. This helps you understand which products are driving the most revenue.
Add a **Contact Tag** or **Pipeline** condition to segment revenue by a particular customer segment or sales process. For example, show revenue from contacts tagged as "Enterprise" separately from "SMB."
## Supported chart types
Revenue widgets support all standard visualization formats:
| Chart type | Best use for payments |
| ------------------ | ----------------------------------------------------------------------------- |
| **Numeric** | Single total revenue or transaction count KPI |
| **Donut** | Payment status distribution or revenue by product |
| **Line chart** | Revenue trend over time — best for identifying seasonality or growth patterns |
| **Bar chart** | Comparing revenue across products, months, or team members |
| **Horizontal bar** | Ranking products or categories by revenue |
| **Table** | Itemized list of individual transactions with payment amount and status |
## Building a revenue performance dashboard
For a comprehensive financial overview, combine multiple payment widgets on a dedicated revenue dashboard:
1. **Total revenue this month** — numeric widget with a current-month date range override
2. **Revenue vs. last month** — same widget with a comparison date range enabled
3. **Revenue over time (30 days)** — line chart showing daily revenue trend
4. **Payment status breakdown** — donut chart showing paid versus pending versus failed
5. **Monthly recurring revenue** — numeric widget filtered to subscription payment types
6. **Top revenue products** — horizontal bar chart ranked by total revenue per product
Revenue data in the dashboard reflects payments processed directly through the HoopAI platform's Payments features. Payments processed through external systems not connected to the platform will not appear in these widgets.
## Frequently asked questions
Confirm that the selected date range covers a period during which payments were collected. Also verify that any conditions applied in the Conditions tab are not filtering out all transactions. Check that the Payment Status condition (if applied) is set to "Paid" rather than "Pending" or another status.
Yes. Use the Conditions tab to filter by payment type. Add a condition for the subscription or payment plan type to isolate recurring revenue from one-time transactions.
Refunded transactions are recorded with a Refunded status. The total revenue widget filtered to Paid status will not include refunded amounts. To account for refunds, use a custom metric that subtracts refunded amounts from total collected revenue.
Yes. Click on a data point within the revenue widget to open the Granular Insights view, which lists individual transaction records. Use the export icon to download the records as a CSV for further analysis.
Click the **Payments** tab in the widget panel to browse all available revenue and payment widgets.
Select the widget that matches your reporting need — for example, **Total Revenue** for a KPI tile or **Revenue Over Time** for a trend line.
Click the **three dots** on the widget and select **Edit** to configure the title, metrics, date range, and any conditions. Click **Save**, then **Save Changes**.
## Available payment widget types
| Widget type | Description |
| ---------------------------- | --------------------------------------------------------------------- |
| **Total revenue** | Sum of all completed payment amounts within the selected period |
| **Total transactions** | Count of all processed payment transactions |
| **Revenue over time** | Line or bar chart trending revenue across the date range |
| **Payment status breakdown** | Donut or bar chart showing paid, pending, failed, and refunded counts |
## Configuring the total revenue widget
The total revenue widget is the most commonly used payment widget. When configuring it:
**Metrics:** Select **Sum** as the metric and choose the revenue amount field. This gives you the total dollar amount collected within the selected period.
**Date range:** By default, the widget uses the dashboard's global time frame. Apply a **Date Range Override** to lock the widget to a specific period — for example, always showing the current month's revenue regardless of what the global date selector is set to.
**Comparison date range:** Enable a comparison period to show revenue alongside the prior period's figure. This adds a percentage change indicator that immediately shows whether revenue is up or down versus the comparison period.
Pair a total revenue numeric widget with a revenue over time line chart widget side by side. The numeric tile gives the summary number while the line chart provides the trend context — together they tell a more complete story than either widget alone.
## Filtering revenue widgets
Use the **Conditions** tab to segment your payment data:
Add a **Payment Status** condition to isolate specific transaction states. Common uses include a "Pending Payments" widget (filter to Pending status) placed alongside a "Collected Revenue" widget (filter to Paid status) to show outstanding versus received amounts.
If your account uses products or services in invoices and payment links, add a **Product** condition to show revenue from a specific offering. This helps you understand which products are driving the most revenue.
Add a **Contact Tag** or **Pipeline** condition to segment revenue by a particular customer segment or sales process. For example, show revenue from contacts tagged as "Enterprise" separately from "SMB."
## Supported chart types
Revenue widgets support all standard visualization formats:
| Chart type | Best use for payments |
| ------------------ | ----------------------------------------------------------------------------- |
| **Numeric** | Single total revenue or transaction count KPI |
| **Donut** | Payment status distribution or revenue by product |
| **Line chart** | Revenue trend over time — best for identifying seasonality or growth patterns |
| **Bar chart** | Comparing revenue across products, months, or team members |
| **Horizontal bar** | Ranking products or categories by revenue |
| **Table** | Itemized list of individual transactions with payment amount and status |
## Building a revenue performance dashboard
For a comprehensive financial overview, combine multiple payment widgets on a dedicated revenue dashboard:
1. **Total revenue this month** — numeric widget with a current-month date range override
2. **Revenue vs. last month** — same widget with a comparison date range enabled
3. **Revenue over time (30 days)** — line chart showing daily revenue trend
4. **Payment status breakdown** — donut chart showing paid versus pending versus failed
5. **Monthly recurring revenue** — numeric widget filtered to subscription payment types
6. **Top revenue products** — horizontal bar chart ranked by total revenue per product
Revenue data in the dashboard reflects payments processed directly through the HoopAI platform's Payments features. Payments processed through external systems not connected to the platform will not appear in these widgets.
## Frequently asked questions
Confirm that the selected date range covers a period during which payments were collected. Also verify that any conditions applied in the Conditions tab are not filtering out all transactions. Check that the Payment Status condition (if applied) is set to "Paid" rather than "Pending" or another status.
Yes. Use the Conditions tab to filter by payment type. Add a condition for the subscription or payment plan type to isolate recurring revenue from one-time transactions.
Refunded transactions are recorded with a Refunded status. The total revenue widget filtered to Paid status will not include refunded amounts. To account for refunds, use a custom metric that subtracts refunded amounts from total collected revenue.
Yes. Click on a data point within the revenue widget to open the Granular Insights view, which lists individual transaction records. Use the export icon to download the records as a CSV for further analysis.