> ## Documentation Index
> Fetch the complete documentation index at: https://help.hoopai.com/llms.txt
> Use this file to discover all available pages before exploring further.
# Dashboard overview
> Custom widgets, date filters, permissions, themes, goal tracking, sharing, and exporting.
The Dashboard is your central command center in the HoopAI platform. It provides a real-time visual summary of business performance — surfacing metrics like pipeline value, conversion rates, revenue, reputation, and team tasks across fully customizable widget layouts.
 Add, remove, and arrange widgets to build a dashboard tailored to your workflow.
Explore all available widget types and what data each one displays.
Create, rename, duplicate, and delete dashboards across your account.
Control which users and roles can view or edit each dashboard.
Switch between light and dark themes or apply custom color settings.
Refine widget data on the fly without permanently editing the dashboard layout.
Track scheduled and completed appointments across your team.
Monitor open conversations, response times, and messaging volume.
View revenue totals, payment trends, and transaction breakdowns.
Track review counts, average ratings, and reputation trends over time.
Visualize leads moving through each stage of your pipelines.
Set targets for key metrics and measure progress against them.
Apply custom date ranges to control the time period shown across all widgets.
Share dashboards with team members or external stakeholders via links.
Display Google Analytics traffic data directly inside your dashboard.
Download dashboard data as a report for offline review or distribution.
## Getting started
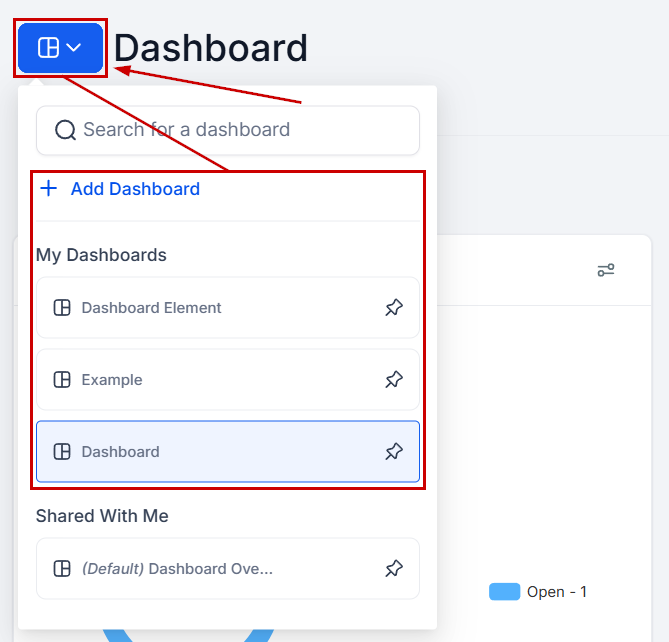
Navigate to **Dashboard** in the left sidebar. If multiple dashboards exist, use the switcher at the top to select the one you want to work with.
Use the time frame selector to set the date range for all widget data. This applies globally to every widget on the current dashboard.
Click the **Edit** icon to enter edit mode. Add widgets from the widget library, drag them to reorder, and resize them to fit your workflow.
Use Quick Filters to refine data across widgets — for example, filtering by a specific pipeline, team member, or lead source — without permanently changing the layout.
Share the dashboard with your team using the sharing options, or export the data as a report for stakeholder review.
## Frequently asked questions
Yes. Dashboard permissions let you control which users or roles have access to each dashboard. You can create separate dashboards for different teams — for example, one for sales, one for marketing, and one for management — and restrict access accordingly.
No. Quick filters are saved per user. When you apply a quick filter, it only changes the view for your own session and does not affect what other users see on the same dashboard.
Yes. From pages like the Call Report tab, Appointment Report tab, or Opportunities section, look for the grid icon to send a widget directly to a selected dashboard without entering edit mode.
Click the **three dots** in the top-right corner of the dashboard and select **Manage Dashboard Time Zone**. You can switch between your location's time zone and your personal time zone. The setting applies across all dashboards you view.
Yes. Use the dashboard switcher at the top of the page to toggle between dashboards or add a new one. There is no hard limit on the number of dashboards you can create.
The widget will display an empty or error state until the data source is reconnected or the widget is removed. Deleting a pipeline or disconnecting an integration does not automatically remove the widget from the dashboard.
Add, remove, and arrange widgets to build a dashboard tailored to your workflow.
Explore all available widget types and what data each one displays.
Create, rename, duplicate, and delete dashboards across your account.
Control which users and roles can view or edit each dashboard.
Switch between light and dark themes or apply custom color settings.
Refine widget data on the fly without permanently editing the dashboard layout.
Track scheduled and completed appointments across your team.
Monitor open conversations, response times, and messaging volume.
View revenue totals, payment trends, and transaction breakdowns.
Track review counts, average ratings, and reputation trends over time.
Visualize leads moving through each stage of your pipelines.
Set targets for key metrics and measure progress against them.
Apply custom date ranges to control the time period shown across all widgets.
Share dashboards with team members or external stakeholders via links.
Display Google Analytics traffic data directly inside your dashboard.
Download dashboard data as a report for offline review or distribution.
## Getting started
Navigate to **Dashboard** in the left sidebar. If multiple dashboards exist, use the switcher at the top to select the one you want to work with.
Use the time frame selector to set the date range for all widget data. This applies globally to every widget on the current dashboard.
Click the **Edit** icon to enter edit mode. Add widgets from the widget library, drag them to reorder, and resize them to fit your workflow.
Use Quick Filters to refine data across widgets — for example, filtering by a specific pipeline, team member, or lead source — without permanently changing the layout.
Share the dashboard with your team using the sharing options, or export the data as a report for stakeholder review.
## Frequently asked questions
Yes. Dashboard permissions let you control which users or roles have access to each dashboard. You can create separate dashboards for different teams — for example, one for sales, one for marketing, and one for management — and restrict access accordingly.
No. Quick filters are saved per user. When you apply a quick filter, it only changes the view for your own session and does not affect what other users see on the same dashboard.
Yes. From pages like the Call Report tab, Appointment Report tab, or Opportunities section, look for the grid icon to send a widget directly to a selected dashboard without entering edit mode.
Click the **three dots** in the top-right corner of the dashboard and select **Manage Dashboard Time Zone**. You can switch between your location's time zone and your personal time zone. The setting applies across all dashboards you view.
Yes. Use the dashboard switcher at the top of the page to toggle between dashboards or add a new one. There is no hard limit on the number of dashboards you can create.
The widget will display an empty or error state until the data source is reconnected or the widget is removed. Deleting a pipeline or disconnecting an integration does not automatically remove the widget from the dashboard.