> ## Documentation Index
> Fetch the complete documentation index at: https://help.hoopai.com/llms.txt
> Use this file to discover all available pages before exploring further.
# Google Analytics widget
> Display website traffic, user behavior, and conversion data from Google Analytics directly on your HoopAI dashboard.
The Google Analytics widget category lets you surface key website performance metrics from your connected Google Analytics 4 (GA4) property directly on your HoopAI platform dashboard. Instead of switching between your CRM and a separate analytics tool, you can monitor traffic, user behavior, and goal completions alongside your leads, appointments, and revenue data — all in one place.
## What Google Analytics widgets display
Once your GA4 property is connected, the following types of data can be displayed on your dashboard:
* **Sessions** — the total number of website sessions within the selected date range
* **Users** — the number of unique users who visited your website
* **New users** — first-time visitors within the period
* **Bounce rate** — percentage of sessions where users left without interacting with a second page
* **Average session duration** — average time users spend on your site per session
* **Goal completions** — conversion events configured in GA4 (such as form submissions or phone clicks)
* **Traffic source breakdown** — distribution of sessions by source (organic search, paid, direct, social, referral)
* **Page views** — total number of pages viewed across all sessions
## Prerequisites
To use Google Analytics widgets, your GA4 property must be connected to the HoopAI platform:
1. Navigate to **Settings** and open the **Integrations** section
2. Locate the **Google Analytics** integration and click **Connect**
3. Sign in with the Google account that has access to your GA4 property
4. Select the GA4 property you want to connect
5. Save the integration
Once connected, the Google Analytics widget category becomes available in the Add Widget panel on your dashboard.
## Adding a Google Analytics widget
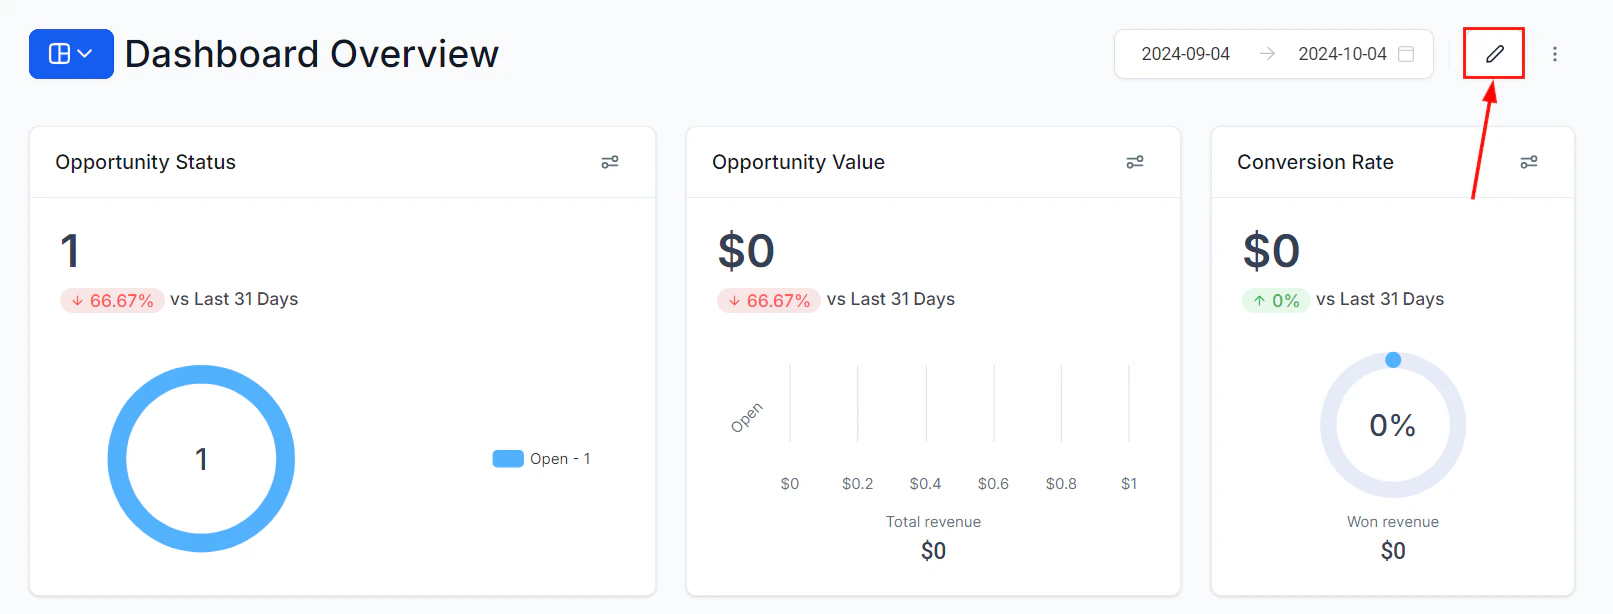 Click the **pencil icon** on your dashboard to enter edit mode.
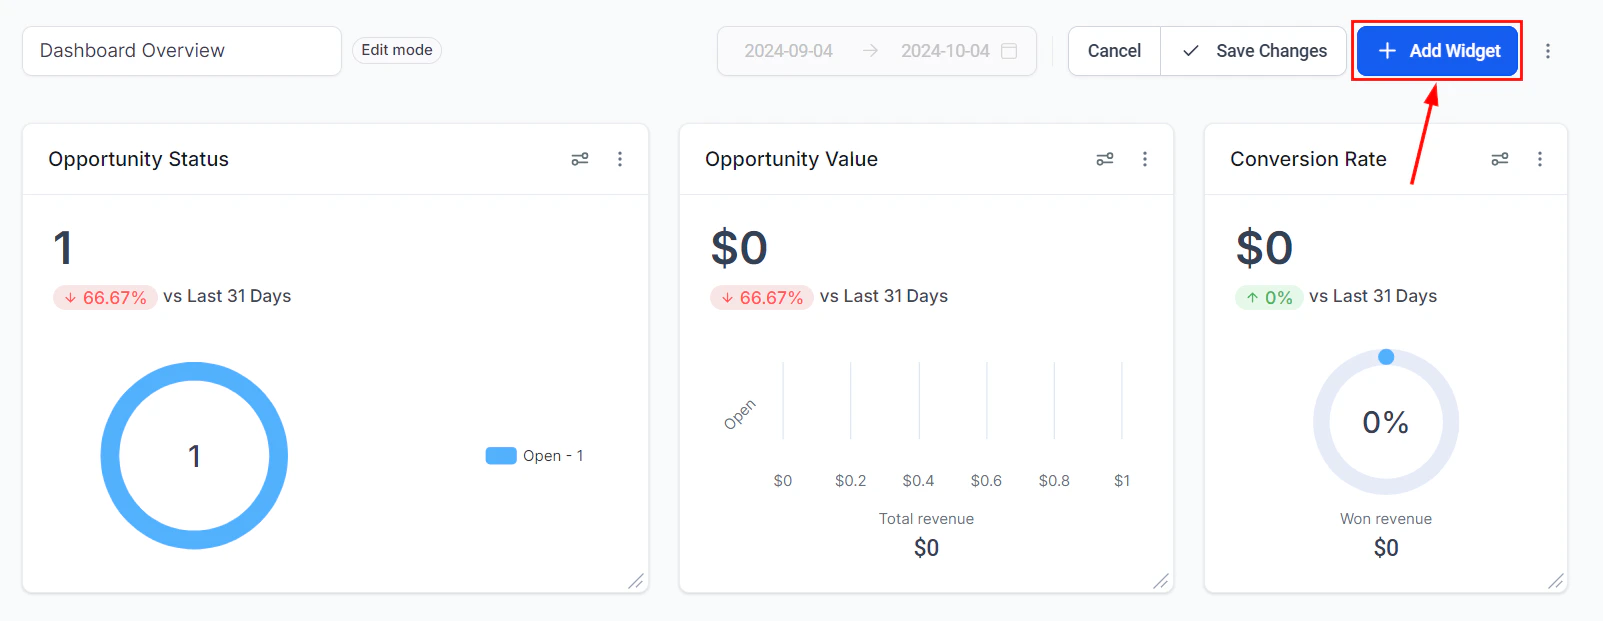
Click **"Add Widget"** to open the widget selection panel.
Click the **pencil icon** on your dashboard to enter edit mode.
Click **"Add Widget"** to open the widget selection panel.
 Navigate to the **Google Analytics** category in the widget panel. You will see the available GA4 metric widgets listed.
Click the metric widget you want to add — for example, Sessions or Goal Completions. The widget is placed on your dashboard.
Click the **three dots** on the widget and select **Edit** to open the configuration panel. Set the title, metric, chart type, and date range. Click **Save**, then **Save Changes**.
## Configuring Google Analytics widgets
### Selecting a metric
In the Configure tab, choose the specific GA4 metric to display. Metrics include Sessions, Users, New Users, Bounce Rate, Average Session Duration, and any custom events or conversions you have set up in your GA4 property.
### Date range
Google Analytics widgets respect the dashboard's global time frame selector by default. Apply a **Date Range Override** to lock the widget to a specific period — for example, always showing the trailing 30 days of traffic data regardless of the global date setting.
### Chart type
Select the chart format that best represents your data:
| Chart type | Best use |
| -------------- | ---------------------------------------------------------------- |
| **Numeric** | Single metric KPI tile — sessions count, user count, bounce rate |
| **Line chart** | Traffic trends over time — daily or weekly sessions |
| **Bar chart** | Comparison by traffic source or time period |
| **Donut** | Distribution of sessions by source or device type |
### Breakdown / View by
For trend widgets, choose the breakdown interval — daily, weekly, or monthly — to control the granularity of the chart.
For most marketing dashboards, a combination works best: one numeric widget showing total sessions, one line chart showing session trends over the past 30 days, and one donut chart showing traffic source distribution. These three widgets together give a quick but comprehensive view of website health.
## Combining Google Analytics and CRM data
The real power of the Google Analytics widget becomes apparent when you display it alongside CRM metrics from the HoopAI platform. Suggested pairings:
| GA4 widget | Paired CRM widget | What you can analyze |
| ------------------------ | --------------------------- | ----------------------------------------------------------------- |
| Sessions | New contacts | Website visit to lead conversion rate |
| Goal completions | Opportunities created | Form-fill to pipeline entry rate |
| Traffic source breakdown | Contacts by source | Whether your reported traffic sources match your lead attribution |
| Bounce rate (trend) | Conversation volume (trend) | Whether high bounce periods correlate with low engagement |
## Supported dimensions
Beyond the standard metrics, Google Analytics widgets can display data broken down by dimensions such as:
* **Traffic source** — organic, paid, direct, referral, social
* **Device category** — desktop, mobile, tablet
* **Landing page** — which pages users enter the site on
* **Country or region** — geographic distribution of visitors
## Frequently asked questions
The HoopAI platform integrates with Google Analytics 4 (GA4). If your account is still using Universal Analytics, you will need to migrate your property to GA4 before the widget category becomes available.
The Google Analytics widget category only appears after a GA4 property is successfully connected in your account's Integrations settings. Verify that the integration is active and that the correct GA4 property is selected.
GA4 data in the HoopAI platform dashboard syncs periodically. There is typically a delay of several hours between activity on your website and when it appears in the dashboard widgets, which is consistent with standard GA4 data processing timelines.
Each connected GA4 property feeds into the Google Analytics widget category. If you manage multiple websites, you can connect multiple GA4 properties and use conditions or separate widgets to display data from each. Contact support for guidance on multi-property configurations.
Yes, provided the goals or conversion events are configured in your GA4 property. The widget will reflect the conversion events you have defined in GA4, such as form submissions, phone number clicks, or purchase completions.
Navigate to the **Google Analytics** category in the widget panel. You will see the available GA4 metric widgets listed.
Click the metric widget you want to add — for example, Sessions or Goal Completions. The widget is placed on your dashboard.
Click the **three dots** on the widget and select **Edit** to open the configuration panel. Set the title, metric, chart type, and date range. Click **Save**, then **Save Changes**.
## Configuring Google Analytics widgets
### Selecting a metric
In the Configure tab, choose the specific GA4 metric to display. Metrics include Sessions, Users, New Users, Bounce Rate, Average Session Duration, and any custom events or conversions you have set up in your GA4 property.
### Date range
Google Analytics widgets respect the dashboard's global time frame selector by default. Apply a **Date Range Override** to lock the widget to a specific period — for example, always showing the trailing 30 days of traffic data regardless of the global date setting.
### Chart type
Select the chart format that best represents your data:
| Chart type | Best use |
| -------------- | ---------------------------------------------------------------- |
| **Numeric** | Single metric KPI tile — sessions count, user count, bounce rate |
| **Line chart** | Traffic trends over time — daily or weekly sessions |
| **Bar chart** | Comparison by traffic source or time period |
| **Donut** | Distribution of sessions by source or device type |
### Breakdown / View by
For trend widgets, choose the breakdown interval — daily, weekly, or monthly — to control the granularity of the chart.
For most marketing dashboards, a combination works best: one numeric widget showing total sessions, one line chart showing session trends over the past 30 days, and one donut chart showing traffic source distribution. These three widgets together give a quick but comprehensive view of website health.
## Combining Google Analytics and CRM data
The real power of the Google Analytics widget becomes apparent when you display it alongside CRM metrics from the HoopAI platform. Suggested pairings:
| GA4 widget | Paired CRM widget | What you can analyze |
| ------------------------ | --------------------------- | ----------------------------------------------------------------- |
| Sessions | New contacts | Website visit to lead conversion rate |
| Goal completions | Opportunities created | Form-fill to pipeline entry rate |
| Traffic source breakdown | Contacts by source | Whether your reported traffic sources match your lead attribution |
| Bounce rate (trend) | Conversation volume (trend) | Whether high bounce periods correlate with low engagement |
## Supported dimensions
Beyond the standard metrics, Google Analytics widgets can display data broken down by dimensions such as:
* **Traffic source** — organic, paid, direct, referral, social
* **Device category** — desktop, mobile, tablet
* **Landing page** — which pages users enter the site on
* **Country or region** — geographic distribution of visitors
## Frequently asked questions
The HoopAI platform integrates with Google Analytics 4 (GA4). If your account is still using Universal Analytics, you will need to migrate your property to GA4 before the widget category becomes available.
The Google Analytics widget category only appears after a GA4 property is successfully connected in your account's Integrations settings. Verify that the integration is active and that the correct GA4 property is selected.
GA4 data in the HoopAI platform dashboard syncs periodically. There is typically a delay of several hours between activity on your website and when it appears in the dashboard widgets, which is consistent with standard GA4 data processing timelines.
Each connected GA4 property feeds into the Google Analytics widget category. If you manage multiple websites, you can connect multiple GA4 properties and use conditions or separate widgets to display data from each. Contact support for guidance on multi-property configurations.
Yes, provided the goals or conversion events are configured in your GA4 property. The widget will reflect the conversion events you have defined in GA4, such as form submissions, phone number clicks, or purchase completions.