> ## Documentation Index
> Fetch the complete documentation index at: https://help.hoopai.com/llms.txt
> Use this file to discover all available pages before exploring further.
# Funnel widget
> Visualize how leads move through your pipeline stages with the funnel widget — track counts, values, and conversion rates at each stage.
The funnel widget provides a visual representation of how leads progress through the stages of your sales pipeline. At a glance, you can see how many opportunities exist at each stage, the total value associated with those opportunities, and the conversion rate from one stage to the next. This makes it easy to identify where deals are stalling and which stages in your process are the most effective.
## What the funnel widget shows
The funnel widget displays your pipeline as a series of stages stacked vertically, with each stage narrowing to reflect the drop-off as leads advance. For each stage you can see:
* **Lead count** — the number of opportunities currently at or that passed through that stage within the selected period
* **Stage value** — the total monetary value of opportunities at that stage
* **Conversion percentage** — the percentage of leads that moved from one stage to the next
This data is calculated based on the pipeline and date range you configure on the widget.
## Adding the funnel widget to your dashboard
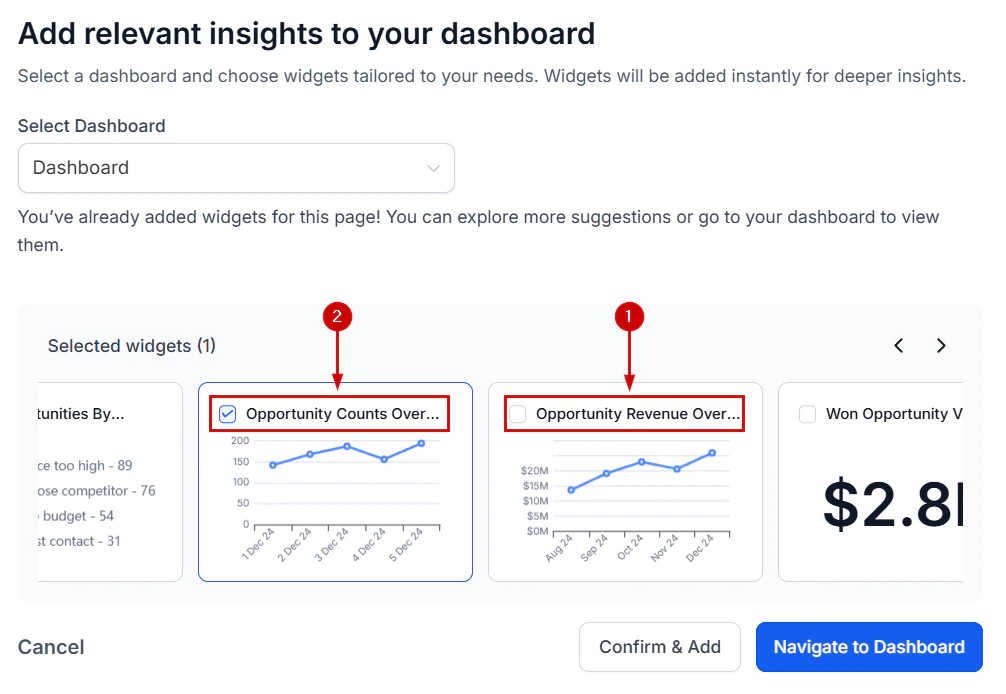 Navigate to your dashboard and click the **pencil icon** to enter edit mode.
Click **"Add Widget"** in the top-right corner. The widget selection panel opens on the right.
Navigate to the **Opportunities** category. Look for the **Funnel** widget type, or use the search bar and type "funnel."
Click the funnel widget to add it to your dashboard. It will appear in the dashboard layout ready for configuration.
Click the **three dots** on the widget and select **Edit** to open the configuration panel.
## Configuring the funnel widget
Once you open the configuration panel, adjust the following settings to tailor the funnel to your needs:
### Pipeline selection
Choose which pipeline to display. You can only display one pipeline per funnel widget. If you manage multiple pipelines, add separate funnel widgets — one per pipeline — to compare them side by side on the same dashboard.
### Stage selection
By default, all stages in the selected pipeline are included. You can include or exclude specific stages using the **Conditions** tab. For example, filter to only show the stages that matter most for a particular team or reporting purpose.
### Date range
Set the date range to define which opportunities are included in the funnel. The funnel counts opportunities that were active within the selected period based on the date property you choose (Created On, Updated On, or Status Change).
### Display metric
Choose whether the funnel stages display:
* **Count** — number of opportunities per stage
* **Value** — total monetary value per stage
* **Both** — displays count and value together
Use the **Value** display metric for revenue-focused dashboards where the monetary potential at each stage matters more than the raw count of leads.
## Filtering the funnel by pipeline stages
To narrow the funnel to specific stages — for example, only showing the bottom-of-funnel stages relevant to a closing team:
1. Open the widget editor and go to the **Conditions** tab
2. Click **Add Condition** and select **Pipeline** — choose your pipeline
3. Click **+ And** and select **Stage**
4. Choose the specific stages you want to include
5. Save the widget
## Reading the funnel visualization
Navigate to your dashboard and click the **pencil icon** to enter edit mode.
Click **"Add Widget"** in the top-right corner. The widget selection panel opens on the right.
Navigate to the **Opportunities** category. Look for the **Funnel** widget type, or use the search bar and type "funnel."
Click the funnel widget to add it to your dashboard. It will appear in the dashboard layout ready for configuration.
Click the **three dots** on the widget and select **Edit** to open the configuration panel.
## Configuring the funnel widget
Once you open the configuration panel, adjust the following settings to tailor the funnel to your needs:
### Pipeline selection
Choose which pipeline to display. You can only display one pipeline per funnel widget. If you manage multiple pipelines, add separate funnel widgets — one per pipeline — to compare them side by side on the same dashboard.
### Stage selection
By default, all stages in the selected pipeline are included. You can include or exclude specific stages using the **Conditions** tab. For example, filter to only show the stages that matter most for a particular team or reporting purpose.
### Date range
Set the date range to define which opportunities are included in the funnel. The funnel counts opportunities that were active within the selected period based on the date property you choose (Created On, Updated On, or Status Change).
### Display metric
Choose whether the funnel stages display:
* **Count** — number of opportunities per stage
* **Value** — total monetary value per stage
* **Both** — displays count and value together
Use the **Value** display metric for revenue-focused dashboards where the monetary potential at each stage matters more than the raw count of leads.
## Filtering the funnel by pipeline stages
To narrow the funnel to specific stages — for example, only showing the bottom-of-funnel stages relevant to a closing team:
1. Open the widget editor and go to the **Conditions** tab
2. Click **Add Condition** and select **Pipeline** — choose your pipeline
3. Click **+ And** and select **Stage**
4. Choose the specific stages you want to include
5. Save the widget
## Reading the funnel visualization
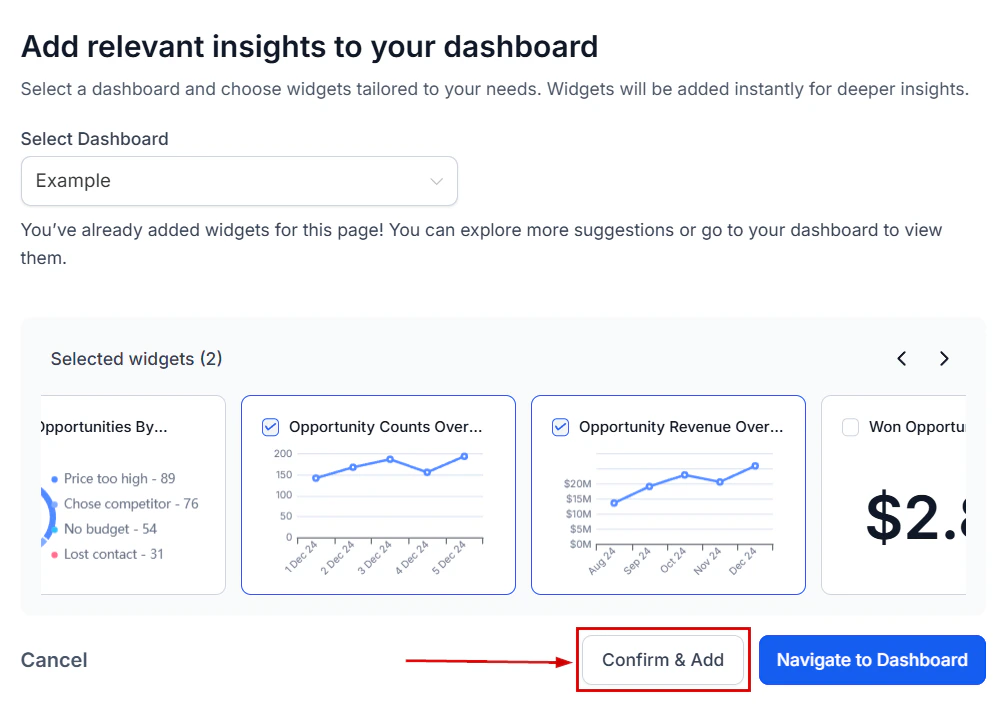 Each bar in the funnel represents one pipeline stage. The width of each bar is proportional to the number (or value) of opportunities at that stage relative to the top of the funnel. Hover over any bar to see the exact count and value for that stage.
The percentage shown between stages represents how many opportunities moved from the stage above to the next stage. A high drop-off percentage between two stages indicates a potential bottleneck in your sales process.
## Using the funnel alongside other opportunity widgets
The funnel widget works best alongside complementary widgets that provide additional context:
* **Total opportunities** widget — shows the overall pipeline count for quick reference
* **Opportunity value** widget — displays total open, won, and lost value
* **Conversion rate** widget — provides the overall won/total ratio
* **Lost opportunities by reason** widget — shows why deals are falling out of the funnel
Arrange these widgets together on a dedicated pipeline performance dashboard to give your team a complete view of sales health.
## Frequently asked questions
No. Each funnel widget is tied to a single pipeline. To compare multiple pipelines, add separate funnel widgets for each and arrange them side by side on the dashboard.
If you have applied stage conditions in the Conditions tab, only the specified stages will appear. Additionally, stages with zero opportunities in the selected date range may be hidden — check that your date range is set correctly and that opportunities exist in the selected pipeline.
The conversion rate between two adjacent stages is calculated as the count (or value) at the lower stage divided by the count (or value) at the stage directly above it, expressed as a percentage.
Yes. Click on any stage bar within the funnel widget to open the Granular Insights view, which lists the individual opportunity records at that stage. From there, use the export icon to download the records as a CSV file.
Each bar in the funnel represents one pipeline stage. The width of each bar is proportional to the number (or value) of opportunities at that stage relative to the top of the funnel. Hover over any bar to see the exact count and value for that stage.
The percentage shown between stages represents how many opportunities moved from the stage above to the next stage. A high drop-off percentage between two stages indicates a potential bottleneck in your sales process.
## Using the funnel alongside other opportunity widgets
The funnel widget works best alongside complementary widgets that provide additional context:
* **Total opportunities** widget — shows the overall pipeline count for quick reference
* **Opportunity value** widget — displays total open, won, and lost value
* **Conversion rate** widget — provides the overall won/total ratio
* **Lost opportunities by reason** widget — shows why deals are falling out of the funnel
Arrange these widgets together on a dedicated pipeline performance dashboard to give your team a complete view of sales health.
## Frequently asked questions
No. Each funnel widget is tied to a single pipeline. To compare multiple pipelines, add separate funnel widgets for each and arrange them side by side on the dashboard.
If you have applied stage conditions in the Conditions tab, only the specified stages will appear. Additionally, stages with zero opportunities in the selected date range may be hidden — check that your date range is set correctly and that opportunities exist in the selected pipeline.
The conversion rate between two adjacent stages is calculated as the count (or value) at the lower stage divided by the count (or value) at the stage directly above it, expressed as a percentage.
Yes. Click on any stage bar within the funnel widget to open the Granular Insights view, which lists the individual opportunity records at that stage. From there, use the export icon to download the records as a CSV file.