> ## Documentation Index
> Fetch the complete documentation index at: https://help.hoopai.com/llms.txt
> Use this file to discover all available pages before exploring further.
# Exporting dashboards
> Export dashboard widget data as CSV files using Granular Insights, and schedule automated data reports directly from your dashboard.
The HoopAI platform provides several ways to get your dashboard data out of the platform — whether you need to share a report with a stakeholder, run further analysis in a spreadsheet, or schedule automated recurring data exports. This guide covers all available export methods and how to use them effectively.
## Exporting widget data as CSV
Every custom widget on your dashboard supports data export through the **Granular Insights** view. Granular Insights shows the individual records that make up a widget's aggregated metric, and from there you can download those records as a CSV file.
### How to export from a widget
From your dashboard, click on any data point within a widget — for example, click a bar in a bar chart, a segment of a donut chart, or the number in a numeric tile.
The Granular Insights panel opens, listing the individual records that contribute to the value you clicked. For example, clicking a "Total Appointments" widget opens a list of individual appointment records within that widget's date range.
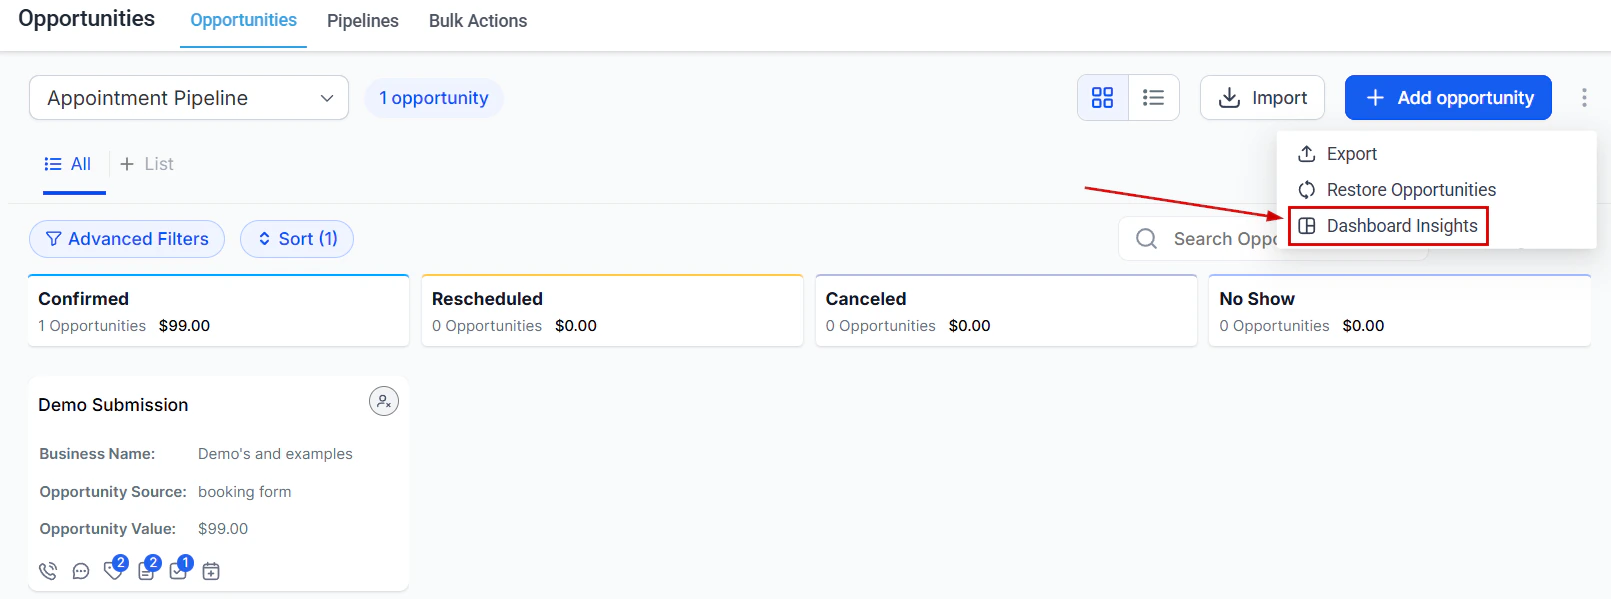 Click the **export icon** (a downward arrow or download icon) in the Granular Insights panel. The platform begins preparing the file and downloads it to your device.
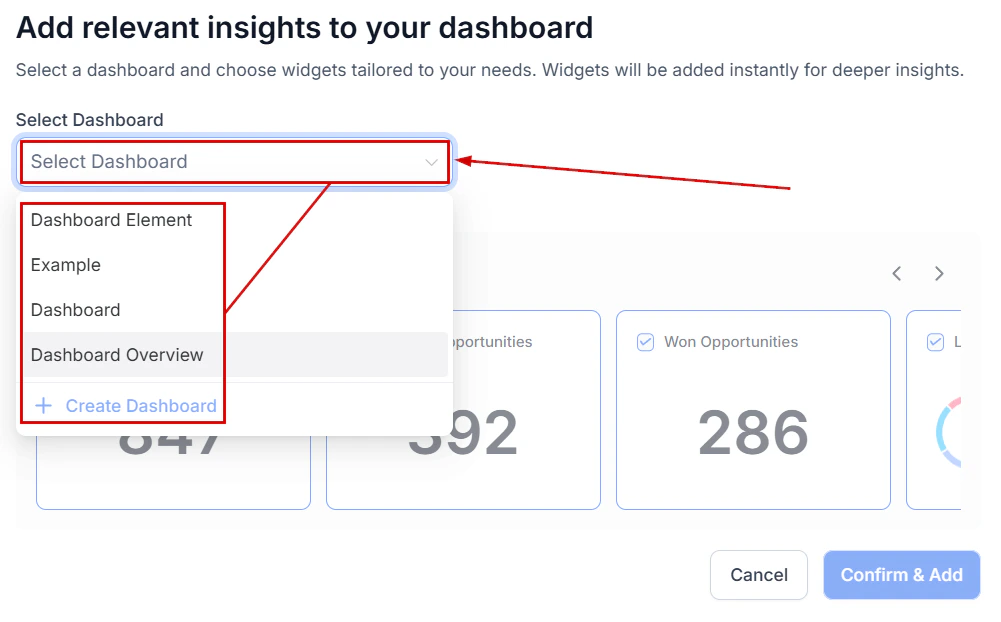 Do not switch or close your browser tab while an export is in progress. Large datasets may take a moment to prepare. Once complete, the file downloads automatically.
### What the CSV export includes
The exported CSV includes the individual records visible in the Granular Insights view, with columns corresponding to the fields relevant to that widget's data type. For example:
* **Appointment widgets** — contact name, appointment date, status, assignee, calendar
* **Opportunity widgets** — contact name, opportunity name, pipeline, stage, value, status, created date
* **Contact widgets** — name, email, phone, tags, assignee, created date
* **Payment widgets** — contact name, payment amount, status, payment date, product
## Exporting full dashboard views
While the platform does not offer a single-click full dashboard PDF export at this time, you can capture a static view of your dashboard using your browser's built-in print or save as PDF functionality:
1. Set your dashboard to the desired date range and layout
2. Use your browser's **Print** function (typically Ctrl+P on Windows or Cmd+P on Mac)
3. In the print dialog, select **Save as PDF** as the destination
4. Adjust print settings such as orientation (landscape is recommended for wide dashboards) and scale
5. Save the PDF to your device
Before capturing the dashboard as a PDF, zoom out your browser to 75–80% so more of the dashboard fits on fewer pages. Use your browser's zoom control (Ctrl+- on Windows, Cmd+- on Mac) to reduce the zoom level before printing.
## Scheduled reports
Rather than manually exporting data, you can schedule automated reports that deliver widget data to your email inbox on a recurring basis. Scheduled reports can be set up directly from the Dashboard section.
### Setting up a scheduled report
Click the **three dots** in the top-right corner of the dashboard.
Choose **"Schedule Report"** from the options menu.
Set the report name, select the widgets or data to include, choose the frequency (daily, weekly, monthly), and specify the delivery time and time zone.
Enter the email addresses of everyone who should receive the scheduled report. Recipients do not need to have a HoopAI platform account.
Click **Save** to activate the schedule. The report will be delivered automatically at the configured frequency.
Scheduled reports deliver a summary of widget data in the email body or as an attachment, depending on your configuration. This is particularly useful for weekly performance summaries sent to leadership or monthly reporting for clients.
## Limitations
All custom widgets in categories such as Contacts, Appointments, Opportunities, Conversations, Calls, and Payments support Granular Insights and CSV export. General category widgets (such as Google Ads summary or Facebook Ads summary) that depend on third-party platform data do not support Granular Insights or CSV export.
Large datasets export completely, but generating very large CSV files may take several minutes. Keep the tab open and active during the export process. For very large datasets, consider narrowing the date range or applying conditions to the widget before exporting to reduce the file size.
At present, exports are done one widget at a time through the Granular Insights view. To export data from multiple widgets, export each widget separately and combine the CSV files in a spreadsheet tool such as Excel or Google Sheets.
Yes. When setting up a scheduled report, you can add any email address as a recipient — the recipient does not need to have an account in the HoopAI platform to receive the report email.
## Frequently asked questions
The export icon appears after the Granular Insights panel loads its data. If the panel is still loading or shows an error, the export option may not be visible. Wait for the data to fully load and try again. Also verify that your widget is using a supported data category (not a General/third-party widget).
Open the dashboard options menu, select "Schedule Report," and find the existing schedule in the list. Toggle it off or delete it to stop future deliveries.
The platform does not include a native image export. You can use your operating system's screenshot tool to capture the visible portion of the dashboard as an image.
Do not switch or close your browser tab while an export is in progress. Large datasets may take a moment to prepare. Once complete, the file downloads automatically.
### What the CSV export includes
The exported CSV includes the individual records visible in the Granular Insights view, with columns corresponding to the fields relevant to that widget's data type. For example:
* **Appointment widgets** — contact name, appointment date, status, assignee, calendar
* **Opportunity widgets** — contact name, opportunity name, pipeline, stage, value, status, created date
* **Contact widgets** — name, email, phone, tags, assignee, created date
* **Payment widgets** — contact name, payment amount, status, payment date, product
## Exporting full dashboard views
While the platform does not offer a single-click full dashboard PDF export at this time, you can capture a static view of your dashboard using your browser's built-in print or save as PDF functionality:
1. Set your dashboard to the desired date range and layout
2. Use your browser's **Print** function (typically Ctrl+P on Windows or Cmd+P on Mac)
3. In the print dialog, select **Save as PDF** as the destination
4. Adjust print settings such as orientation (landscape is recommended for wide dashboards) and scale
5. Save the PDF to your device
Before capturing the dashboard as a PDF, zoom out your browser to 75–80% so more of the dashboard fits on fewer pages. Use your browser's zoom control (Ctrl+- on Windows, Cmd+- on Mac) to reduce the zoom level before printing.
## Scheduled reports
Rather than manually exporting data, you can schedule automated reports that deliver widget data to your email inbox on a recurring basis. Scheduled reports can be set up directly from the Dashboard section.
### Setting up a scheduled report
Click the **three dots** in the top-right corner of the dashboard.
Choose **"Schedule Report"** from the options menu.
Set the report name, select the widgets or data to include, choose the frequency (daily, weekly, monthly), and specify the delivery time and time zone.
Enter the email addresses of everyone who should receive the scheduled report. Recipients do not need to have a HoopAI platform account.
Click **Save** to activate the schedule. The report will be delivered automatically at the configured frequency.
Scheduled reports deliver a summary of widget data in the email body or as an attachment, depending on your configuration. This is particularly useful for weekly performance summaries sent to leadership or monthly reporting for clients.
## Limitations
All custom widgets in categories such as Contacts, Appointments, Opportunities, Conversations, Calls, and Payments support Granular Insights and CSV export. General category widgets (such as Google Ads summary or Facebook Ads summary) that depend on third-party platform data do not support Granular Insights or CSV export.
Large datasets export completely, but generating very large CSV files may take several minutes. Keep the tab open and active during the export process. For very large datasets, consider narrowing the date range or applying conditions to the widget before exporting to reduce the file size.
At present, exports are done one widget at a time through the Granular Insights view. To export data from multiple widgets, export each widget separately and combine the CSV files in a spreadsheet tool such as Excel or Google Sheets.
Yes. When setting up a scheduled report, you can add any email address as a recipient — the recipient does not need to have an account in the HoopAI platform to receive the report email.
## Frequently asked questions
The export icon appears after the Granular Insights panel loads its data. If the panel is still loading or shows an error, the export option may not be visible. Wait for the data to fully load and try again. Also verify that your widget is using a supported data category (not a General/third-party widget).
Open the dashboard options menu, select "Schedule Report," and find the existing schedule in the list. Toggle it off or delete it to stop future deliveries.
The platform does not include a native image export. You can use your operating system's screenshot tool to capture the visible portion of the dashboard as an image.