> ## Documentation Index
> Fetch the complete documentation index at: https://help.hoopai.com/llms.txt
> Use this file to discover all available pages before exploring further.
# Custom widgets
> Add, configure, and customize data visualization widgets on your Hoop dashboard to track contacts, opportunities, calls, conversations, and more.
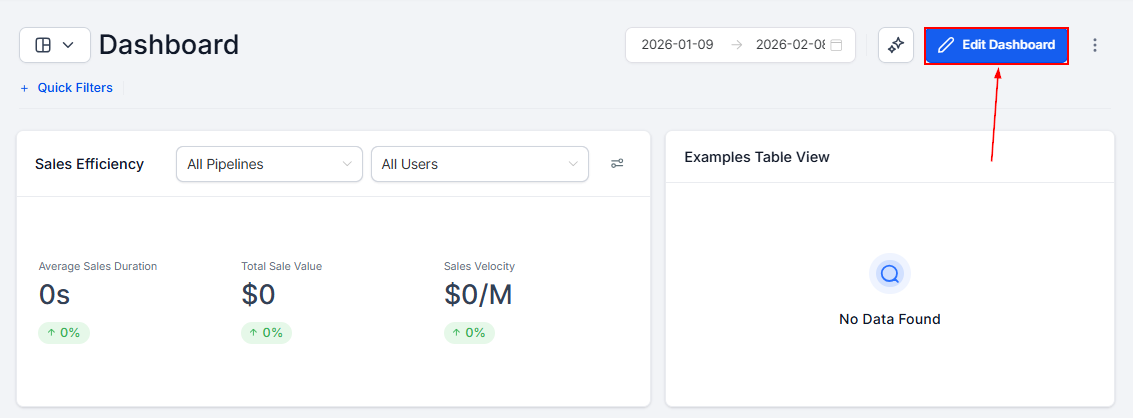
Widgets are versatile, customizable data visualization tools that let you analyze and present your business data for enhanced insights and reporting. You can add, modify, or delete widgets from the Dashboard section by clicking the **Edit Dashboard** button.
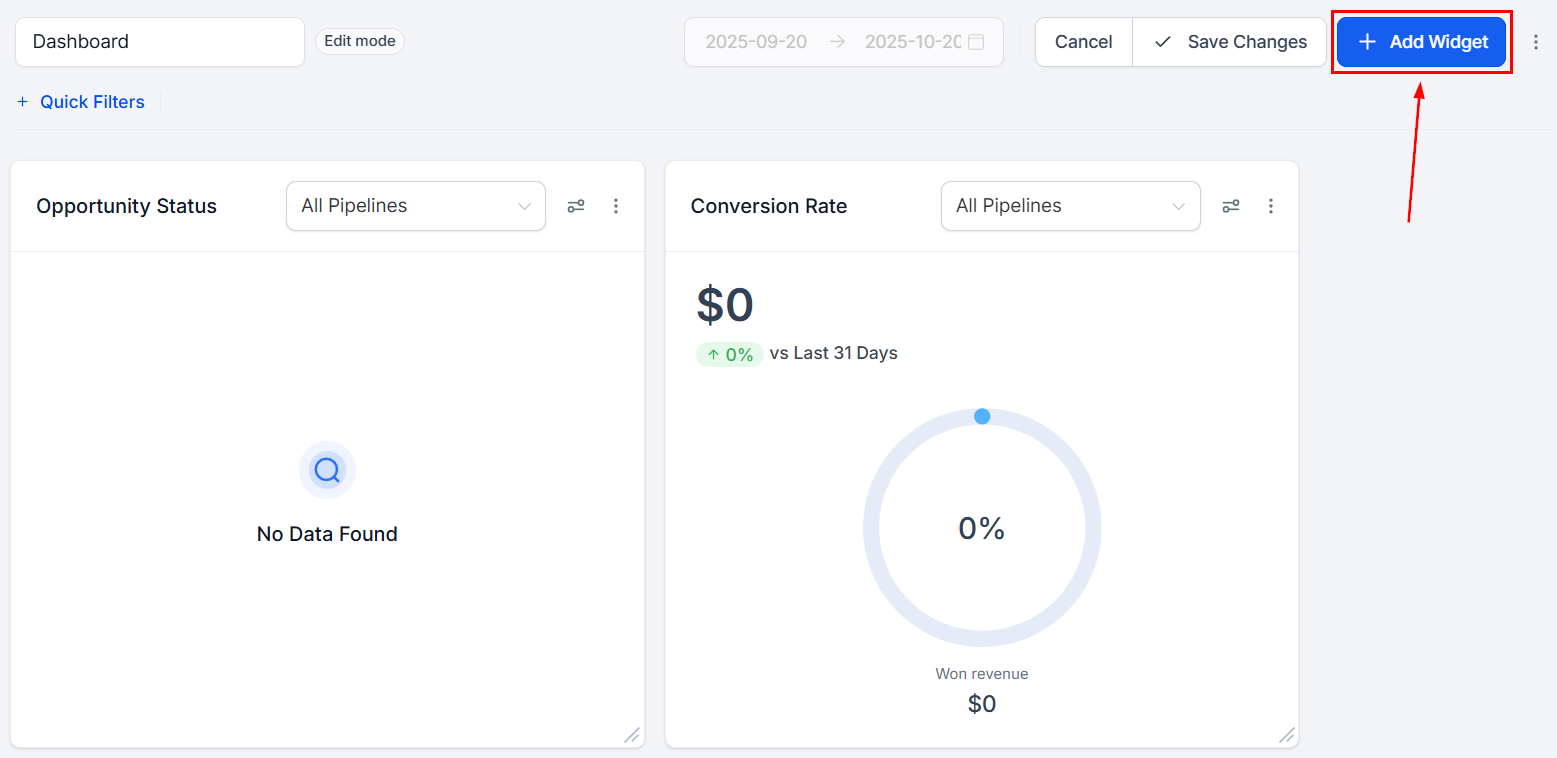
 To add a widget, click the **"Add Widget"** button in the top-right corner of your dashboard.
## Widget categories
To add a widget, click the **"Add Widget"** button in the top-right corner of your dashboard.
## Widget categories
 Manage and analyze leads, focusing on tags, activity, or assigned team members.
Track and optimize meetings, view by status or assignee, and monitor appointment trends.
Gain insights into deal status, monetary value, and progression over time.
Analyze visitor interactions and engagement metrics.
View key email metrics such as click-through and open rates.
Monitor call activities, duration, and trends by attendee or status.
Track and analyze communication threads across various channels.
Track transactions, revenue trends, and payment statuses to monitor business performance.
Track and analyze Meta Ads performance trends to monitor paid traffic at a glance.
Analyze social media publishing performance, engagement trends, and content activity across connected platforms.
View website performance data including traffic sources, user behavior, conversion metrics, and engagement trends.
Create object-specific widgets for relationships or processes beyond standard CRM objects.
Access predefined performance data across platforms like Google, Facebook, and tasks. Note: General widgets cannot be edited or duplicated.
***
## Individual widget types
Each widget category contains specific, pre-built widget types. Below is a reference of the widgets available across all categories:
| Category | Widget types |
| -------------------- | ------------------------------------------------------------------------------------------------------------------------------------------------------------------ |
| **Contacts** | Total contacts, Contacts by tag, Contacts by source, Contacts over time, Contacts by assignee |
| **Appointments** | Total appointments, Appointments by status, Appointments by assignee, Appointments over time, Confirmed appointments |
| **Opportunities** | Total opportunities, Opportunity value, Opportunities by status, Opportunities by pipeline, Opportunities over time, Lost opportunities by reason, Conversion rate |
| **Visitor data** | Total page visits, Unique visitors, Visits over time |
| **Emails** | Emails sent, Open rate, Click-through rate, Email activity over time |
| **Calls** | Total calls, Calls by direction (inbound/outbound), Call duration, Calls by status, Calls by assignee |
| **Conversations** | Total conversations, Unread messages, Conversations by channel |
| **Payments** | Total revenue, Transactions, Revenue over time, Payment status breakdown |
| **Meta Ads** | Ad impressions, Clicks, Spend, Cost per lead |
| **Social Planner** | Posts published, Engagement rate, Reach, Posts by platform |
| **Google Analytics** | Sessions, Users, Bounce rate, Goal completions |
| **Custom Objects** | Total records, Records over time, Records table view |
| **General** | Google Ads summary, Facebook Ads summary, Tasks overview, GMB activity |
General category widgets are read-only and cannot be edited, duplicated, or configured with conditions.
***
## Supported chart types
Select the chart type that displays your data in the most useful way:
* **Numeric / Count**
* **Donut charts**
* **Line charts**
* **Bar charts**
* **Horizontal bar charts**
* **Tables**
***
## Supported metrics
For widgets that aggregate data, choose from these metric options:
| Metric | Description |
| ----------- | ------------------------------------------------- |
| **Sum** | Total value of the selected metric |
| **Minimum** | Lowest value within the selected data range |
| **Maximum** | Highest value in the selected dataset |
| **Average** | Average value across the dataset |
| **Count** | Total number of items meeting the chosen criteria |
For line, bar, and horizontal bar chart widgets, you can add a second metric for side-by-side comparison.
***
## Adding a widget
Navigate to the Dashboard and click the **pencil icon** to enter edit mode. An "Add Widgets" panel will open on the right.
Browse widget categories, search by name, or filter by chart type. Each widget has a default chart type that you can adjust by clicking the chart icon.
In the **Configure** tab, set the title, metrics, grouping, and date range. Use **Conditions** to apply AND/OR filters. Optionally apply a custom **Theme** to match your dashboard style.
Click **Save** to add the widget to your dashboard. Then resize and reposition it, and click **Save Changes** to finalize.
***
## Widget configuration options
When configuring a widget in the **Configure** tab, you have access to these settings:
| Setting | Description |
| ------------------------- | -------------------------------------------------------------------------- |
| **Title** | Customize the widget's display name |
| **Metrics** | Choose specific data points for the widget |
| **Group** | Define groupings for donut charts |
| **View By** | Select secondary dimensions for bar and line charts |
| **Breakdown** | Adjust frequency of intervals (weekly, monthly, etc.) |
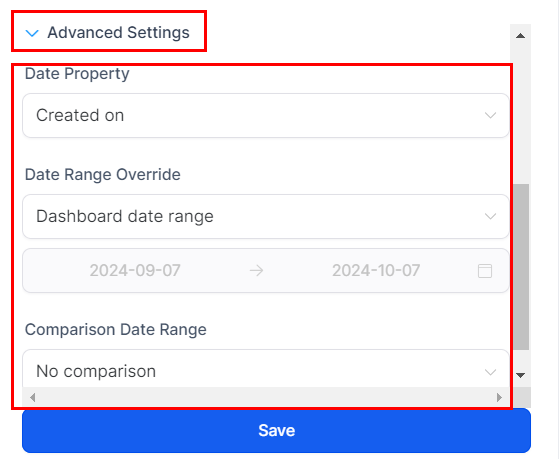
| **Date Property** | Select the date property to filter data (Created Date, Updated Date, etc.) |
| **Date Range Override** | Override the default date range set on the dashboard |
| **Comparison Date Range** | Compare data across different time periods |
| **Order** | Display results ascending or descending |
| **Limit** | Set a cap on the number of results displayed |
Manage and analyze leads, focusing on tags, activity, or assigned team members.
Track and optimize meetings, view by status or assignee, and monitor appointment trends.
Gain insights into deal status, monetary value, and progression over time.
Analyze visitor interactions and engagement metrics.
View key email metrics such as click-through and open rates.
Monitor call activities, duration, and trends by attendee or status.
Track and analyze communication threads across various channels.
Track transactions, revenue trends, and payment statuses to monitor business performance.
Track and analyze Meta Ads performance trends to monitor paid traffic at a glance.
Analyze social media publishing performance, engagement trends, and content activity across connected platforms.
View website performance data including traffic sources, user behavior, conversion metrics, and engagement trends.
Create object-specific widgets for relationships or processes beyond standard CRM objects.
Access predefined performance data across platforms like Google, Facebook, and tasks. Note: General widgets cannot be edited or duplicated.
***
## Individual widget types
Each widget category contains specific, pre-built widget types. Below is a reference of the widgets available across all categories:
| Category | Widget types |
| -------------------- | ------------------------------------------------------------------------------------------------------------------------------------------------------------------ |
| **Contacts** | Total contacts, Contacts by tag, Contacts by source, Contacts over time, Contacts by assignee |
| **Appointments** | Total appointments, Appointments by status, Appointments by assignee, Appointments over time, Confirmed appointments |
| **Opportunities** | Total opportunities, Opportunity value, Opportunities by status, Opportunities by pipeline, Opportunities over time, Lost opportunities by reason, Conversion rate |
| **Visitor data** | Total page visits, Unique visitors, Visits over time |
| **Emails** | Emails sent, Open rate, Click-through rate, Email activity over time |
| **Calls** | Total calls, Calls by direction (inbound/outbound), Call duration, Calls by status, Calls by assignee |
| **Conversations** | Total conversations, Unread messages, Conversations by channel |
| **Payments** | Total revenue, Transactions, Revenue over time, Payment status breakdown |
| **Meta Ads** | Ad impressions, Clicks, Spend, Cost per lead |
| **Social Planner** | Posts published, Engagement rate, Reach, Posts by platform |
| **Google Analytics** | Sessions, Users, Bounce rate, Goal completions |
| **Custom Objects** | Total records, Records over time, Records table view |
| **General** | Google Ads summary, Facebook Ads summary, Tasks overview, GMB activity |
General category widgets are read-only and cannot be edited, duplicated, or configured with conditions.
***
## Supported chart types
Select the chart type that displays your data in the most useful way:
* **Numeric / Count**
* **Donut charts**
* **Line charts**
* **Bar charts**
* **Horizontal bar charts**
* **Tables**
***
## Supported metrics
For widgets that aggregate data, choose from these metric options:
| Metric | Description |
| ----------- | ------------------------------------------------- |
| **Sum** | Total value of the selected metric |
| **Minimum** | Lowest value within the selected data range |
| **Maximum** | Highest value in the selected dataset |
| **Average** | Average value across the dataset |
| **Count** | Total number of items meeting the chosen criteria |
For line, bar, and horizontal bar chart widgets, you can add a second metric for side-by-side comparison.
***
## Adding a widget
Navigate to the Dashboard and click the **pencil icon** to enter edit mode. An "Add Widgets" panel will open on the right.
Browse widget categories, search by name, or filter by chart type. Each widget has a default chart type that you can adjust by clicking the chart icon.
In the **Configure** tab, set the title, metrics, grouping, and date range. Use **Conditions** to apply AND/OR filters. Optionally apply a custom **Theme** to match your dashboard style.
Click **Save** to add the widget to your dashboard. Then resize and reposition it, and click **Save Changes** to finalize.
***
## Widget configuration options
When configuring a widget in the **Configure** tab, you have access to these settings:
| Setting | Description |
| ------------------------- | -------------------------------------------------------------------------- |
| **Title** | Customize the widget's display name |
| **Metrics** | Choose specific data points for the widget |
| **Group** | Define groupings for donut charts |
| **View By** | Select secondary dimensions for bar and line charts |
| **Breakdown** | Adjust frequency of intervals (weekly, monthly, etc.) |
| **Date Property** | Select the date property to filter data (Created Date, Updated Date, etc.) |
| **Date Range Override** | Override the default date range set on the dashboard |
| **Comparison Date Range** | Compare data across different time periods |
| **Order** | Display results ascending or descending |
| **Limit** | Set a cap on the number of results displayed |
 ***
## Applying conditions
Use the **Conditions** tab to apply AND/OR filters to your widget data.
***
## Applying conditions
Use the **Conditions** tab to apply AND/OR filters to your widget data.
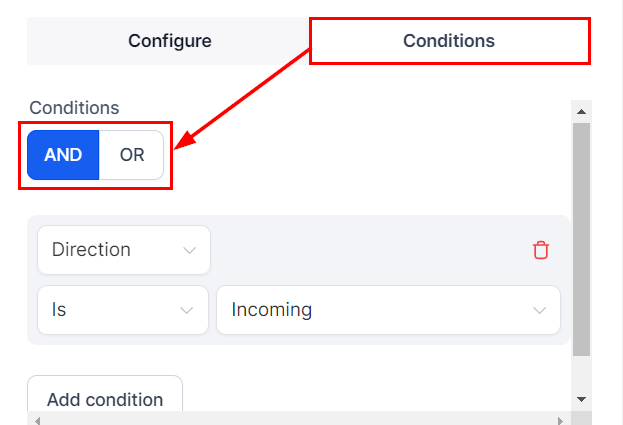 **Available condition operators:**
| Operator | Behavior |
| --------------------------- | ------------------------------ |
| **Is** | Select one option |
| **Is Not** | Exclude one option |
| **Is One Of** | Include multiple options |
| **Is None Of** | Exclude multiple options |
| **Is Empty / Is Not Empty** | Filter on presence of data |
| **Is All Of** | Include options with AND logic |
If no data is found for a filter, the widget cannot be saved until the filter is adjusted or deleted.
***
## Editing widgets
Click the **Edit** button on your dashboard.
Click the **three dots** in the top-right corner of the widget you want to edit. Select **Edit** from the dropdown.
Adjust metrics, title, or appearance in the editing panel. Click **Save**, then **Save Changes** to finalize.
Widgets in the General section cannot be edited.
***
## Removing a widget
Click the **Edit** button on your dashboard.
Click the **three dots** in the top-right corner of the widget. Select **Delete** from the dropdown.
Rearrange the remaining widgets as needed, then click **Save Changes** to finalize the removal.
***
## Duplicating a widget
Click the **Edit** button on your dashboard.
Click the **three dots** on the widget you want to copy and select **Duplicate**. The copied widget appears on the dashboard ready for customization.
Customize the duplicated widget, click **Save**, then **Save Changes**.
Custom widgets in the General section cannot be duplicated or edited.
***
## Rearranging widgets
In edit mode, **click and drag** any widget to reposition it on the dashboard. Click **Save Changes** to lock in the new layout, or **Cancel** to revert.
***
## Resizing widgets
In edit mode, use the **arrow icons** at the corners of a widget to drag and resize it. Click **Save Changes** to confirm, or **Cancel** to undo.
Default widgets like the Opportunity Status widget can be rearranged but are not resizable.
***
## Specialized widget guides
The Call Widget provides a visual and analytical overview of call activity — including inbound and outbound calls, call durations, and participant details.
**To add a call widget:**
Navigate to your dashboard and click **Edit Dashboard**.
Click **Add Widget**, go to the **Calls** tab, and select the call widget that fits your needs.
Fill in the title, select your metric preferences, and use the **Conditions** tab to filter by call direction (inbound only, outbound only, etc.). Click **Save**.
Conversation widgets display metrics related to unread messages, ensuring important communications are never missed. They update in real-time.
**To add a conversation widget:**
Click the Edit Dashboard icon.
Click **+Add Widget** and choose from the Conversations category.
Configure and save the widget. It will update automatically as new messages arrive.
The Task Widget shows task details including title, due date, description, contact name, and assigned user. You can edit or delete tasks directly from the widget, filter by user or status, and sort by due date.
Clicking a task title navigates directly to the related contact page.
Appointment widgets provide a clear view of upcoming appointments. Available widget types include total upcoming appointments for the next week, total appointments created in the last month, and the number of confirmed appointments within a time frame.
Chart types available: numeric, donut, line, bar, horizontal bar, and table.
Opportunity widgets include a date filter that lets you choose which date property to use when calculating data. Options are:
* **Status Change** — filter by the date the opportunity status last changed
* **Created On** — filter by when the opportunity was created
* **Updated On** — filter by when the opportunity was last updated
The filter applies to all opportunity cards on your dashboard. This is useful for comparing opportunities created in a period versus those that closed in the same period.
Filter opportunity widgets by the reason an opportunity was lost to analyze patterns in your sales process.
**To add a Lost Opportunities by Reason widget:**
1. In edit mode, click **Add Widget** and choose **Lost Opportunities By Reason** from the Opportunities section.
2. In the Conditions tab, set **Status IS Lost**.
3. Add a second condition for a specific Lost Reason if needed.
**To add a Lost Reason column to a Table widget:**
1. Choose a Table chart type for an opportunities widget.
2. Click **Select Columns** in the widget configuration.
3. Enable the **Lost Reason** column and save.
Contact and opportunity widgets support filtering by attribution data — including first and last touch attribution — and UTM parameters. This helps you understand where your contacts are coming from.
**Supported attribution fields:**
* UTM Campaign, Campaign ID, Content, Keyword, Matchtype, Medium, Ad ID, Ad Group ID, Source
* Session Source and Medium (for grouping donut charts and line graphs)
**To add attribution filters:**
1. Add or edit a Contact or Opportunity widget.
2. In the **Conditions** tab, click **Add Condition** and select **Attribution**.
3. Choose **First** or **Latest** attribution.
4. Click **Add Attribution Fields** and select the desired UTM property.
UTM parameters and fields are only visible in Table and Granular Insights views when an Attribution type (First or Latest) is added in the widget conditions.
Narrow opportunity widget data to specific pipeline stages for more targeted analysis.
1. In edit mode, add or select an Opportunity widget.
2. In the **Conditions** tab, select **Pipeline** from the dropdown.
3. Click **+ And** and select **Stage** to filter by specific stages within that pipeline.
Custom Object widgets let you monitor records for objects you've created in your account settings. Available types include:
* **Total** — shows the total number of records for the object
* **Count Over Time** — tracks entry trends based on creation date
* **Table View** — displays records with custom fields and filters
Custom object widgets support scheduled reporting and full reporting functionality.
***
## Custom metrics
Custom metrics let you combine multiple metrics from different data sources, apply calculations, and display the results as a widget.
Click the pencil icon to enter edit mode on the Dashboard, then click **Add Widget** and switch to the **Custom Metrics** tab.
Click **"+ Create Custom Metric"** and select **Start From Scratch**.
Enter a **Metric Name**, select the **Data Type** (currency, percentage, etc.), and add a **Description**.
Use the formula builder to add metrics, operators, and numbers. The builder validates your formula automatically. Up to 4 metrics per formula are supported.
Optionally choose a date property and specify whether an increase or decrease in the metric is positive.
Click **Create** to save the metric. It appears in the Custom Metrics list and can be added to any dashboard as a widget.
Custom metrics created in the Dashboard section are also available in Custom Reports, and vice versa.
***
## Adding widgets from key pages
You can add widgets to your dashboard directly from these pages:
* **Call Report tab** in the Reporting section
* **Appointment Report tab** in the Reporting section
* **Opportunities tab** in the Opportunities section
Look for the **grid icon** (or three-dot menu in Opportunities) to select a dashboard and send widgets to it. Widgets are added to the bottom of your dashboard where you can reposition and resize them in edit mode.
***
## Embedding external content
You can embed external content — such as third-party dashboards, reports, or tools — directly into your HoopAI dashboard using iframe widgets.
Click the pencil icon to enter dashboard edit mode.
Click **Add Widget** and select the **Embed** or **Custom HTML** widget type from the General category.
Enter the URL of the external content you want to embed. The widget renders the content inline on your dashboard.
Resize the widget as needed, then click **Save Changes**.
Not all external sites allow iframe embedding. If the content does not load, the source site may block embedding via X-Frame-Options headers. Contact the content provider for an embeddable URL.
***
## Insight widgets from key pages
Add widgets to your dashboard directly from key reporting pages without manually configuring them:
* **Call Report tab** — click the grid icon to send call metrics to a dashboard
* **Appointment Report tab** — click the grid icon to add appointment data
* **Opportunities tab** — use the three-dot menu to send opportunity widgets
Widgets added this way appear at the bottom of the selected dashboard. Enter edit mode to reposition and resize them.
***
## Table chart widgets
Table widgets display your data in a sortable, columnar format — useful when you need to see individual records rather than aggregate charts.
To create a table widget:
1. Add or edit a widget and select **Table** as the chart type
2. Click **Select Columns** to choose which fields appear in the table
3. Set sort order and row limits
4. Save the widget
Table widgets support:
* Custom column selection (including custom fields and attribution data)
* Sorting by any column
* Click-through to granular insights for any row
* CSV export from the granular insights view
***
## Frequently asked questions
Account Admins have full view access unless otherwise configured. Account Users have access based on their assigned user permissions. Configure per-user visibility in widget Conditions using the "Logged in User" option under the User condition.
In the widget's Conditions tab, add a User condition and set it to "Logged in User." This ensures each team member sees only their own data in that widget.
Check your filter conditions — if conflicting conditions are applied, no data will match. Also verify the date range is set correctly and that data exists for the selected criteria.
Yes. From the main dashboard view, click the three-dot menu and select "Manage Dashboard Time Zone." You can choose between your user-specific time zone and the default location time zone.
**Available condition operators:**
| Operator | Behavior |
| --------------------------- | ------------------------------ |
| **Is** | Select one option |
| **Is Not** | Exclude one option |
| **Is One Of** | Include multiple options |
| **Is None Of** | Exclude multiple options |
| **Is Empty / Is Not Empty** | Filter on presence of data |
| **Is All Of** | Include options with AND logic |
If no data is found for a filter, the widget cannot be saved until the filter is adjusted or deleted.
***
## Editing widgets
Click the **Edit** button on your dashboard.
Click the **three dots** in the top-right corner of the widget you want to edit. Select **Edit** from the dropdown.
Adjust metrics, title, or appearance in the editing panel. Click **Save**, then **Save Changes** to finalize.
Widgets in the General section cannot be edited.
***
## Removing a widget
Click the **Edit** button on your dashboard.
Click the **three dots** in the top-right corner of the widget. Select **Delete** from the dropdown.
Rearrange the remaining widgets as needed, then click **Save Changes** to finalize the removal.
***
## Duplicating a widget
Click the **Edit** button on your dashboard.
Click the **three dots** on the widget you want to copy and select **Duplicate**. The copied widget appears on the dashboard ready for customization.
Customize the duplicated widget, click **Save**, then **Save Changes**.
Custom widgets in the General section cannot be duplicated or edited.
***
## Rearranging widgets
In edit mode, **click and drag** any widget to reposition it on the dashboard. Click **Save Changes** to lock in the new layout, or **Cancel** to revert.
***
## Resizing widgets
In edit mode, use the **arrow icons** at the corners of a widget to drag and resize it. Click **Save Changes** to confirm, or **Cancel** to undo.
Default widgets like the Opportunity Status widget can be rearranged but are not resizable.
***
## Specialized widget guides
The Call Widget provides a visual and analytical overview of call activity — including inbound and outbound calls, call durations, and participant details.
**To add a call widget:**
Navigate to your dashboard and click **Edit Dashboard**.
Click **Add Widget**, go to the **Calls** tab, and select the call widget that fits your needs.
Fill in the title, select your metric preferences, and use the **Conditions** tab to filter by call direction (inbound only, outbound only, etc.). Click **Save**.
Conversation widgets display metrics related to unread messages, ensuring important communications are never missed. They update in real-time.
**To add a conversation widget:**
Click the Edit Dashboard icon.
Click **+Add Widget** and choose from the Conversations category.
Configure and save the widget. It will update automatically as new messages arrive.
The Task Widget shows task details including title, due date, description, contact name, and assigned user. You can edit or delete tasks directly from the widget, filter by user or status, and sort by due date.
Clicking a task title navigates directly to the related contact page.
Appointment widgets provide a clear view of upcoming appointments. Available widget types include total upcoming appointments for the next week, total appointments created in the last month, and the number of confirmed appointments within a time frame.
Chart types available: numeric, donut, line, bar, horizontal bar, and table.
Opportunity widgets include a date filter that lets you choose which date property to use when calculating data. Options are:
* **Status Change** — filter by the date the opportunity status last changed
* **Created On** — filter by when the opportunity was created
* **Updated On** — filter by when the opportunity was last updated
The filter applies to all opportunity cards on your dashboard. This is useful for comparing opportunities created in a period versus those that closed in the same period.
Filter opportunity widgets by the reason an opportunity was lost to analyze patterns in your sales process.
**To add a Lost Opportunities by Reason widget:**
1. In edit mode, click **Add Widget** and choose **Lost Opportunities By Reason** from the Opportunities section.
2. In the Conditions tab, set **Status IS Lost**.
3. Add a second condition for a specific Lost Reason if needed.
**To add a Lost Reason column to a Table widget:**
1. Choose a Table chart type for an opportunities widget.
2. Click **Select Columns** in the widget configuration.
3. Enable the **Lost Reason** column and save.
Contact and opportunity widgets support filtering by attribution data — including first and last touch attribution — and UTM parameters. This helps you understand where your contacts are coming from.
**Supported attribution fields:**
* UTM Campaign, Campaign ID, Content, Keyword, Matchtype, Medium, Ad ID, Ad Group ID, Source
* Session Source and Medium (for grouping donut charts and line graphs)
**To add attribution filters:**
1. Add or edit a Contact or Opportunity widget.
2. In the **Conditions** tab, click **Add Condition** and select **Attribution**.
3. Choose **First** or **Latest** attribution.
4. Click **Add Attribution Fields** and select the desired UTM property.
UTM parameters and fields are only visible in Table and Granular Insights views when an Attribution type (First or Latest) is added in the widget conditions.
Narrow opportunity widget data to specific pipeline stages for more targeted analysis.
1. In edit mode, add or select an Opportunity widget.
2. In the **Conditions** tab, select **Pipeline** from the dropdown.
3. Click **+ And** and select **Stage** to filter by specific stages within that pipeline.
Custom Object widgets let you monitor records for objects you've created in your account settings. Available types include:
* **Total** — shows the total number of records for the object
* **Count Over Time** — tracks entry trends based on creation date
* **Table View** — displays records with custom fields and filters
Custom object widgets support scheduled reporting and full reporting functionality.
***
## Custom metrics
Custom metrics let you combine multiple metrics from different data sources, apply calculations, and display the results as a widget.
Click the pencil icon to enter edit mode on the Dashboard, then click **Add Widget** and switch to the **Custom Metrics** tab.
Click **"+ Create Custom Metric"** and select **Start From Scratch**.
Enter a **Metric Name**, select the **Data Type** (currency, percentage, etc.), and add a **Description**.
Use the formula builder to add metrics, operators, and numbers. The builder validates your formula automatically. Up to 4 metrics per formula are supported.
Optionally choose a date property and specify whether an increase or decrease in the metric is positive.
Click **Create** to save the metric. It appears in the Custom Metrics list and can be added to any dashboard as a widget.
Custom metrics created in the Dashboard section are also available in Custom Reports, and vice versa.
***
## Adding widgets from key pages
You can add widgets to your dashboard directly from these pages:
* **Call Report tab** in the Reporting section
* **Appointment Report tab** in the Reporting section
* **Opportunities tab** in the Opportunities section
Look for the **grid icon** (or three-dot menu in Opportunities) to select a dashboard and send widgets to it. Widgets are added to the bottom of your dashboard where you can reposition and resize them in edit mode.
***
## Embedding external content
You can embed external content — such as third-party dashboards, reports, or tools — directly into your HoopAI dashboard using iframe widgets.
Click the pencil icon to enter dashboard edit mode.
Click **Add Widget** and select the **Embed** or **Custom HTML** widget type from the General category.
Enter the URL of the external content you want to embed. The widget renders the content inline on your dashboard.
Resize the widget as needed, then click **Save Changes**.
Not all external sites allow iframe embedding. If the content does not load, the source site may block embedding via X-Frame-Options headers. Contact the content provider for an embeddable URL.
***
## Insight widgets from key pages
Add widgets to your dashboard directly from key reporting pages without manually configuring them:
* **Call Report tab** — click the grid icon to send call metrics to a dashboard
* **Appointment Report tab** — click the grid icon to add appointment data
* **Opportunities tab** — use the three-dot menu to send opportunity widgets
Widgets added this way appear at the bottom of the selected dashboard. Enter edit mode to reposition and resize them.
***
## Table chart widgets
Table widgets display your data in a sortable, columnar format — useful when you need to see individual records rather than aggregate charts.
To create a table widget:
1. Add or edit a widget and select **Table** as the chart type
2. Click **Select Columns** to choose which fields appear in the table
3. Set sort order and row limits
4. Save the widget
Table widgets support:
* Custom column selection (including custom fields and attribution data)
* Sorting by any column
* Click-through to granular insights for any row
* CSV export from the granular insights view
***
## Frequently asked questions
Account Admins have full view access unless otherwise configured. Account Users have access based on their assigned user permissions. Configure per-user visibility in widget Conditions using the "Logged in User" option under the User condition.
In the widget's Conditions tab, add a User condition and set it to "Logged in User." This ensures each team member sees only their own data in that widget.
Check your filter conditions — if conflicting conditions are applied, no data will match. Also verify the date range is set correctly and that data exists for the selected criteria.
Yes. From the main dashboard view, click the three-dot menu and select "Manage Dashboard Time Zone." You can choose between your user-specific time zone and the default location time zone.